TL;DR — Two models with the same parameter count and the same serving config can produce a 16× gap in GPU utilization (6% vs 96%), and the reason is GEMM shape, not model size. LinearHead's matmuls are [B, 1024] × [1024, 1024]; SeqLenHead expands input to [B×128, 1024] before every layer, giving tensor cores 128× more output elements per kernel. To read the profiler: high cuLaunchKernelEx share means kernels are small and launch overhead matters; high cudaEventSynchronize can mean either the GPU finished too fast (sync-bound) or the GPU is genuinely busy. Kernel duration disambiguates — sub-millisecond means the former, tens or hundreds of microseconds means the latter.
Part 2 established the bottleneck for mid-large models: the GPU executes kernels efficiently, and idle time comes from memory transfer gaps between batches. Multiple instances fill those gaps by overlapping compute across CUDA streams. Part 3 showed how tiny transformers invert that story — the GPU is so fast that the CPU sync cycle becomes the dominant cost, and config changes barely move the needle. Both posts shared a common variable: the model architecture was fixed, and the investigation was about serving configuration.
This post Part 4 holds the serving configuration fixed and varies the architecture. Three synthetic classification heads, similar parameter count, same Triton stack, same dynamic batching config. The question is: given identical hardware and deployment, why do these architectures produce GPU utilization numbers ranging from 6% to 96%?
The answer is not FLOPs. It is GEMM shape.
Table of contents
- The Setup
- The Three Architectures
- Results
- What the Profiler Shows
- Why Architecture Matters More Than Size
- This Is Not About LLMs
- The Stacked Architecture Trade-Off
- Reading the Profiler to Diagnose the Regime
The Setup
Three synthetic head architectures, all served through the same stack:
Triton Server: nvcr.io/nvidia/tritonserver:26.02-py3. TensorRT: compiled plans for each architecture. GPU: RTX Pro 6000 class (sm80 architecture). Load testing: Locust, 1,000 concurrent users, ~2 minute runs.
All three models share the same dynamic batching configuration:
dynamic_batching {
  preferred_batch_size: [ 128, 256 ]
  max_queue_delay_microseconds: 10000
  preserve_ordering: true
  default_queue_policy {
    timeout_action: REJECT
    default_timeout_microseconds: 120000000
    max_queue_size: 20480
  }
}
The architectures differ in how they structure their computation, not in raw parameter count.
The Three Architectures
1. LinearHead (~48 MB)
Twenty stacked Linear(1024→1024) layers with ReLU activations, final projection to 2 classes. Standard feed-forward stack. Each layer produces a square [1024, 1024] weight matrix; for a batch of 256, the GEMM is [256, 1024] × [1024, 1024].
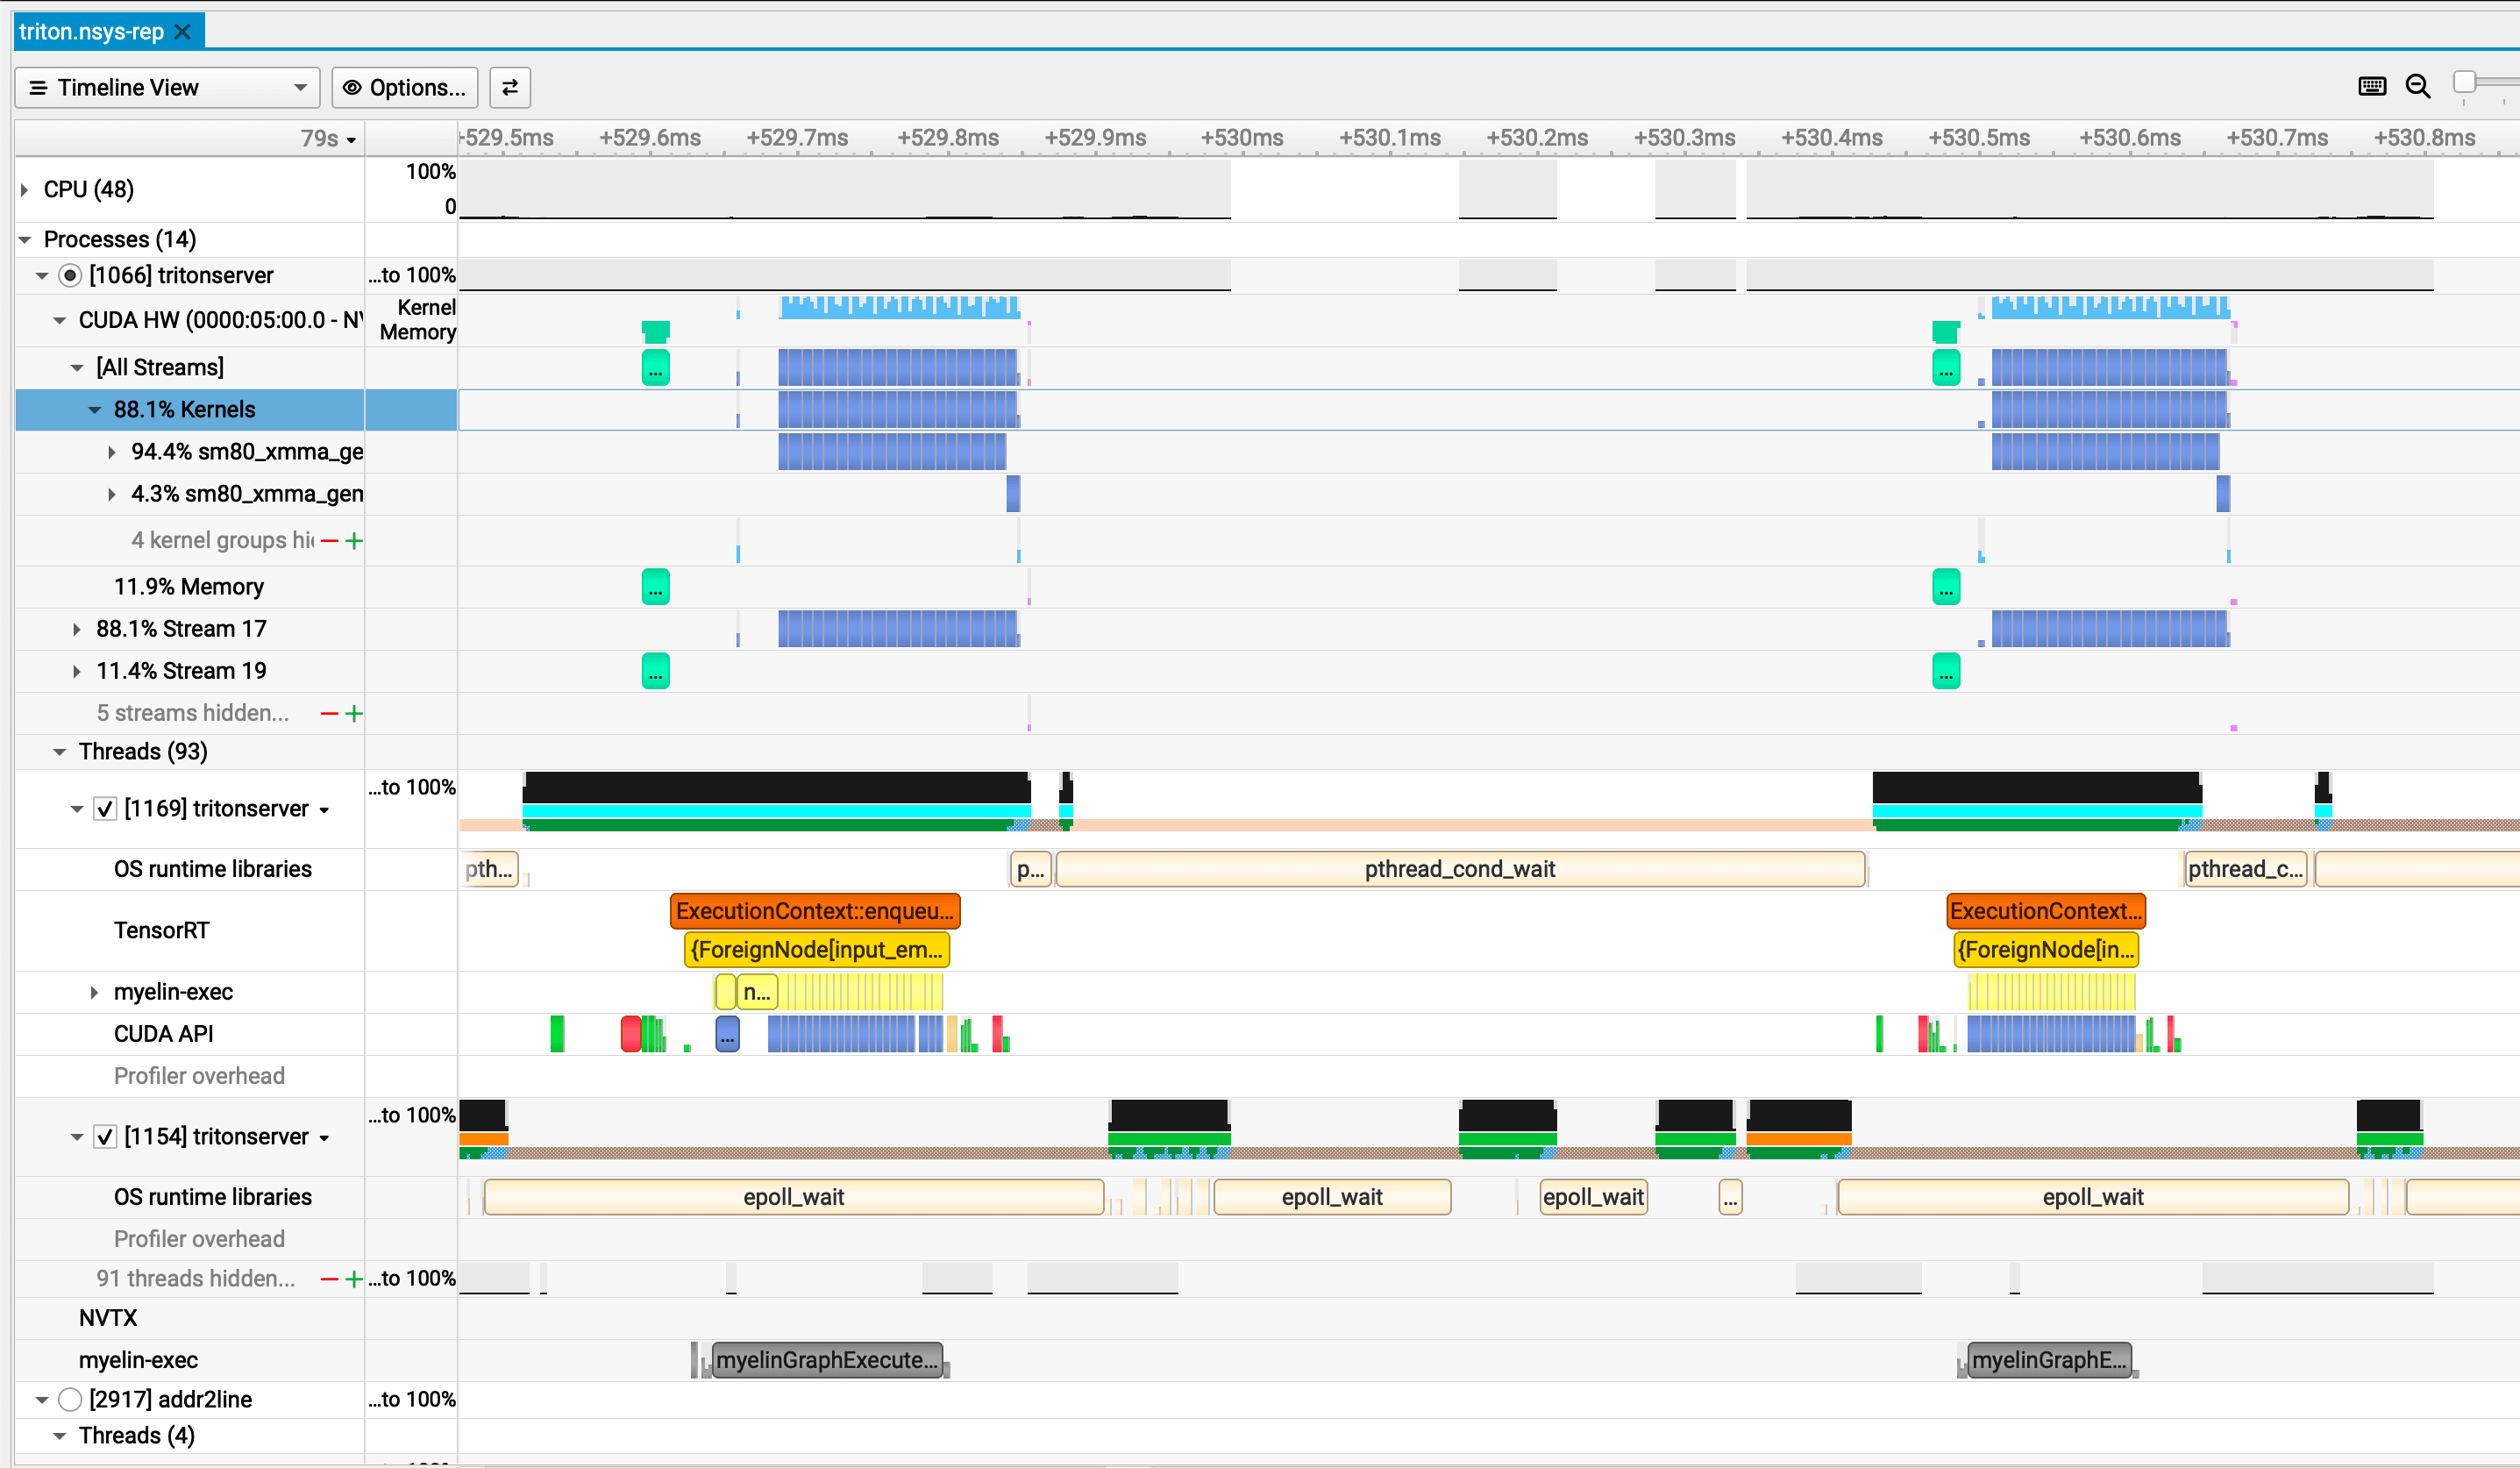
# 20× Linear(1024→1024) + ReLU, final → 2The Nsight timeline for LinearHead shows the characteristic pattern of compute-starved inference. Each batch produces a tight cluster of 20 tiny GEMM kernels — each running about 6.2 µs — that fire and complete nearly instantaneously. After the burst, the GPU goes dark. In the host-threading row, epoll_wait fills the gap as the server event loop idles, then cudaEventSynchronize blocks the CPU thread before it can dispatch the next batch. The inter-batch gap stretches to roughly 650 µs — over 100× the compute burst itself. The GEMMs are too small to fill the SMs — only a fraction of the hardware is active even during those bursts — and between bursts the GPU is entirely idle.
2. LinearHeadStacked (~5 heads, batched via bmm)
Five parallel linear heads fused into batched matrix multiplications. Same total parameters as five individual LinearHeads, but computation is batched through bmm operations that widen the matrix dimensions.
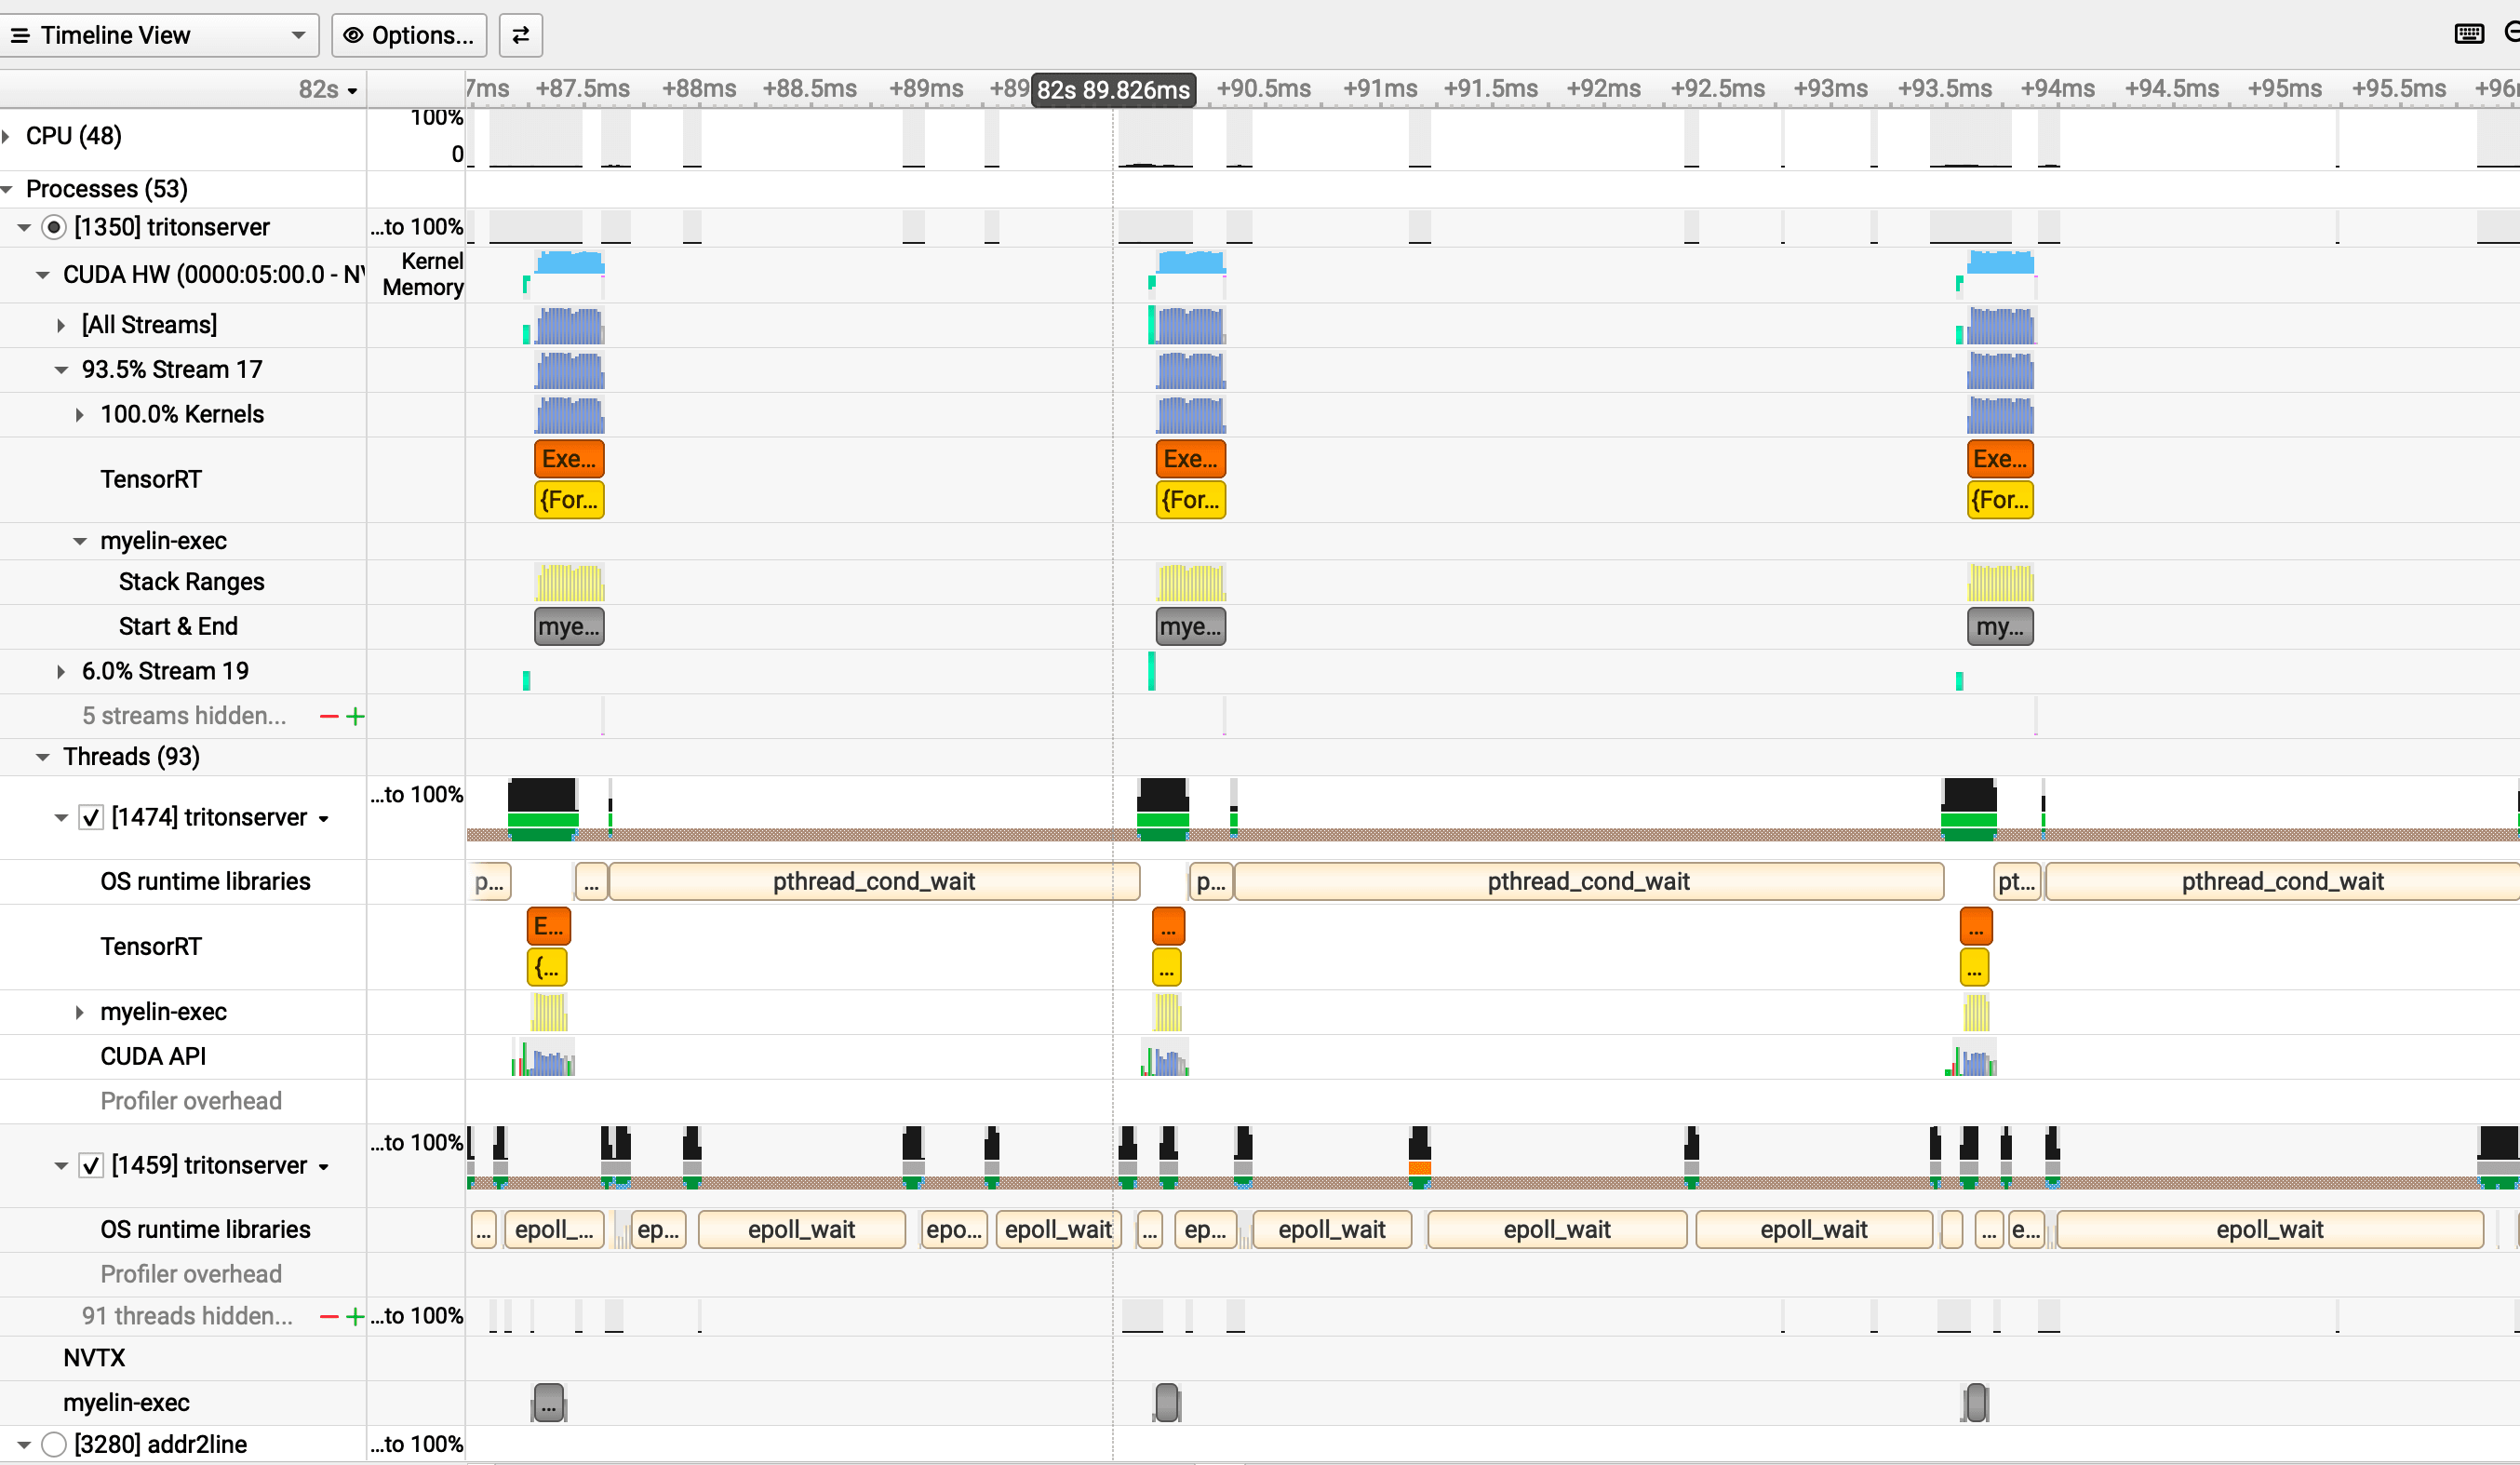
# 5 heads batched via bmm operationsThe stacked timeline looks structurally similar to the Linear case — short bursts separated by large gaps — but each kernel does more work. The bmm fuses all five heads into a single launch — a [5, 256, 1024] × [5, 1024, 1024] batched GEMM that produces ~160 output tiles versus LinearHead's 64 — which roughly doubles the per-kernel duration to ~12 µs. The tile shape differs (128×64×32 versus 64×64×64) but the tile volume is identical; the longer duration comes from more tiles per launch, not a larger tile. The same epoll_wait and synchronization pattern fills the inter-batch window, and the fundamental shape does not change: most of wall time is spent not computing.
3. SeqLenHead (~48 MB)
Expands input to [B, seq_len, H] where seq_len=128, runs through 20 layers with LayerNorm+ReLU, then pools back to [B, 2]. Similar parameter count to LinearHead, but the matmuls are 128× larger per inference — the same [1024, 1024] weight matrices now operate on [B×128, 1024] inputs.
class SeqLenHead(nn.Module):
def __init__(
self,
in_features: int = 1024,
hidden: int = 1024,
num_labels: int = 2,
num_layers: int = 20,
seq_len: int = 128,
):
super().__init__()
self.seq_len = seq_len
self.proj_in = nn.Linear(in_features, hidden)
self.ln_in = nn.LayerNorm(hidden)
mid_layers, mid_norms = [], []
for _ in range(num_layers - 2):
mid_layers.append(nn.Linear(hidden, hidden))
mid_norms.append(nn.LayerNorm(hidden))
self.mid_layers = nn.ModuleList(mid_layers)
self.mid_norms = nn.ModuleList(mid_norms)
self.proj_out = nn.Linear(hidden, num_labels)
def forward(self, x: torch.Tensor) -> torch.Tensor:
x = x.unsqueeze(1).expand(-1, self.seq_len, -1)
h = F.relu(self.ln_in(self.proj_in(x)))
for layer, norm in zip(self.mid_layers, self.mid_norms):
h = F.relu(norm(layer(h)))
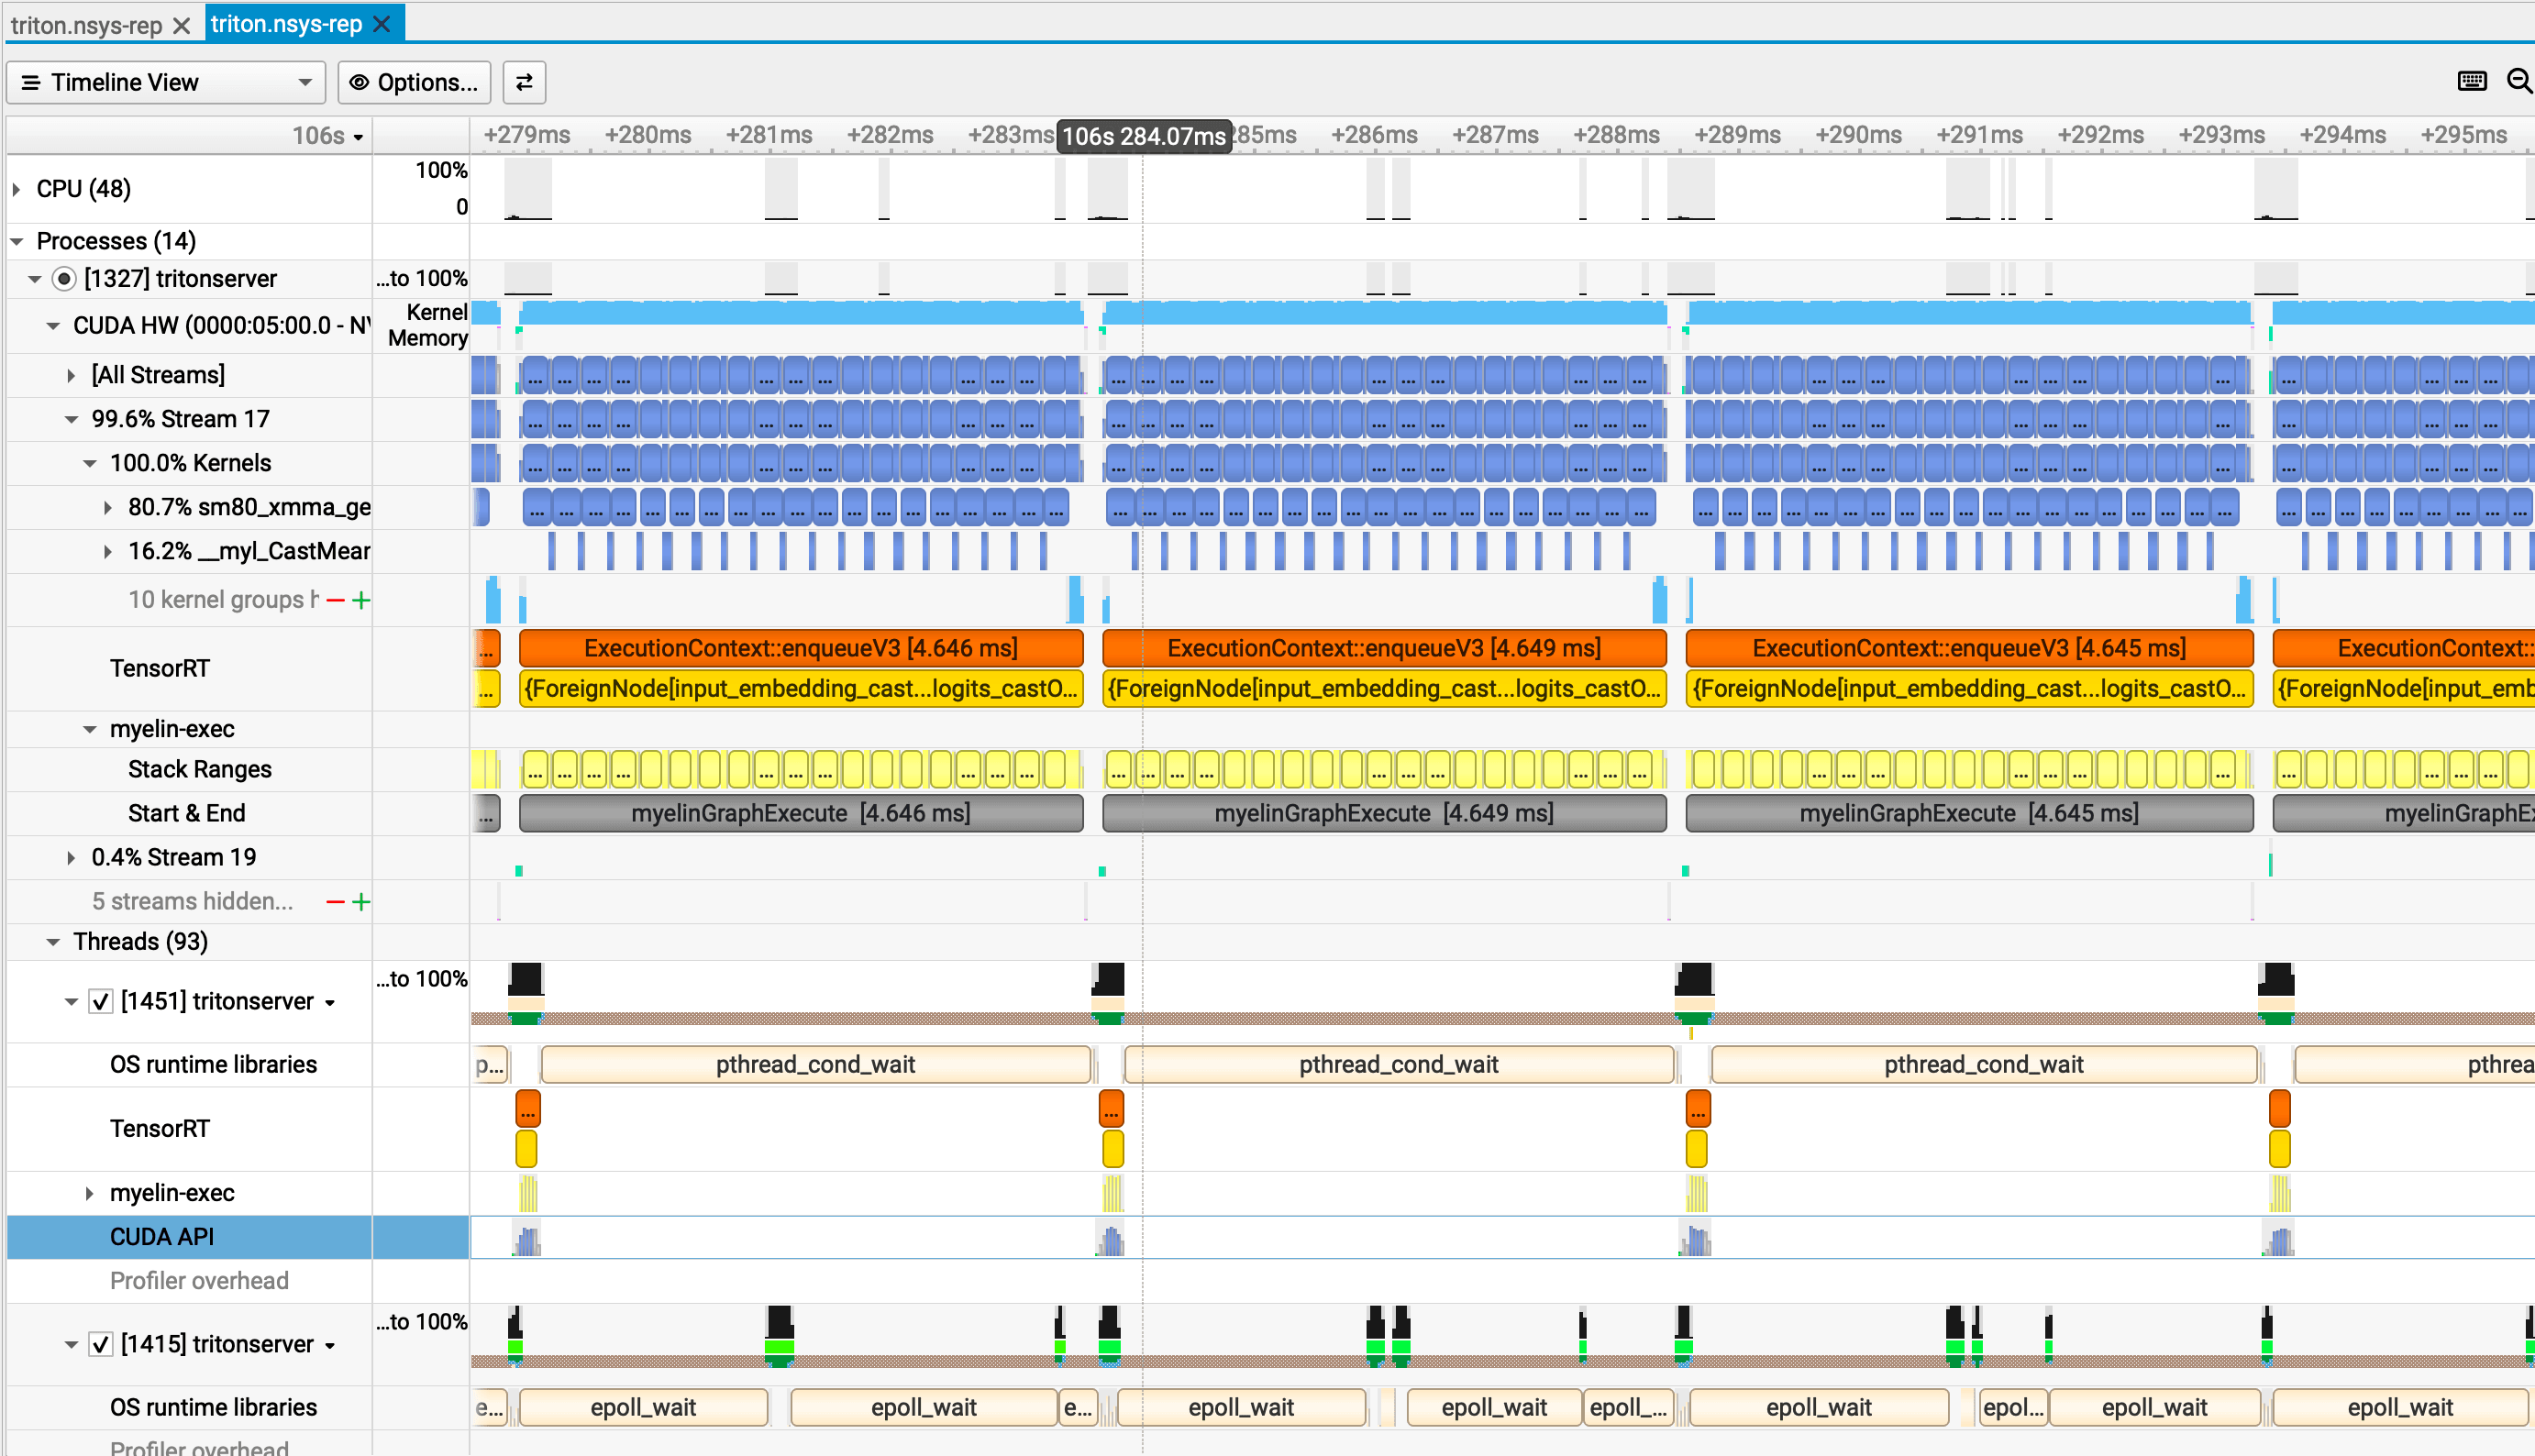
return self.proj_out(h[:, 0, :])The SeqLen timeline looks entirely different. Instead of narrow spikes, the GPU activity row shows a dense, nearly continuous band of compute. Each GEMM kernel runs for ~200 µs — the sequence expansion from [B, 1024] to [B, 128, 1024] gives every matrix multiplication 128× more rows to process, so the tensor cores have sustained work. Fused LayerNorm kernels (CastMeanSubMulMeanAddSqrtDivMulCastMulAddRelu_*) appear as lighter segments between the GEMMs, accounting for roughly 16% of GPU time at ~42 µs each. The gaps between batches are small enough to be nearly invisible at this zoom level — the GPU rarely idles.
Results
GPU Utilization
| Architecture | GPU SM Utilization |
|---|---|
| Linear | ~6% |
| Stacked (5 heads) | ~8–12% |
| SeqLen | ~96–100% |
These are SM utilization figures from nvidia-smi — the fraction of the GPU's compute capacity actively occupied — not temporal kernel activity (fraction of time any kernel is running). Part 2 reported temporal activity for bert-tiny (~50–85%); the two metrics measure different things and should not be compared directly.
Throughput and Latency
| Variant | RPS | Median (ms) | p95 (ms) | Avg (ms) | Requests |
|---|---|---|---|---|---|
| Linear L20 H1024 | 1151.22 | 410 | 580 | 440.97 | 140,217 |
| Stacked (5 heads) | 1195.51 | 390 | 550 | 419.26 | 145,461 |
| SeqLen | 1004.73 | 660 | 1100 | 683.84 | 121,039 |
Stacked edges out plain Linear — higher RPS, lower median latency. SeqLen achieves the highest GPU utilization but does substantially more work per request, resulting in lower RPS and higher latency. The GPU is full, and it's paying for it in throughput.
What the Profiler Shows
CUDA API Summary
| Variant | Top CUDA API calls |
|---|---|
| Linear | cudaEventSynchronize 33.9%; cuLaunchKernelEx 39.4% |
| Stacked | cudaEventSynchronize 56.2%; cuLaunchKernelEx 25.7% |
| SeqLen | cudaEventSynchronize 96.9%; cuLaunchKernel+Ex ~2.3% |
The pattern is direct: as GPU work per kernel increases, the sync percentage rises. Linear spends only 33.9% of CUDA API time waiting for the GPU — that low sync fraction reflects a GPU that finishes fast and idles while the CPU queues more work. SeqLen spends 96.9% waiting, because the GPU is actually busy and the CPU has nothing to do but hold for completion. In Part 2, 97%+ cudaEventSynchronize was the signature of a sync-bound tiny model. Here, the same number means something different: the GPU is the bottleneck, not the CPU.
GPU Kernel Summary
| Variant | Dominant Kernel | Instances | Avg µs/instance |
|---|---|---|---|
| Linear | sm80_xmma_gemm_..._tilesize64x64x64_... |
566,827 | ~6.2 |
| Stacked | sm80_xmma_gemm_..._tilesize128x64x32_..._fused |
583,832 | ~12.3 |
| SeqLen | sm80_xmma_gemm_..._tilesize128x128x32_... |
462,517 | ~199 |
Linear: Tensor core GEMMs average 6.2 µs each, with tile size 64×64×64. For a batch of 256, the matmul is [256, 1024] × [1024, 1024] — 262,144 output elements. The RTX Pro 6000 has enough SMs that this barely fills them. 566,827 kernel launches, each finishing in microseconds, each leaving the GPU starved between launches.
Stacked: GEMMs average 12.3 µs with tile size 128×64×32. The batched bmm operations widen the effective matrix — five heads in one launch rather than five sequential single-head launches. Twice the kernel duration, modest improvement in utilization.
SeqLen: GEMMs average 199 µs with tile size 128×128×32. The seq_len=128 expansion creates matmuls where each weight matrix processes [B×128, 1024] inputs rather than [B, 1024]. For a batch of 256, that is [32,768, 1024] × [1024, 1024] — roughly 128× more output elements than the Linear case. The tensor cores have real work. Each kernel runs 32× longer than Linear's kernels, and cudaEventSynchronize at 96.9% confirms the GPU is what's being waited on.
SeqLen also shows significant time in fused LayerNorm kernels — CastMeanSubMulMeanAddSqrtDivMulCastMulAddRelu_* accounts for ~16.3% of GPU time at ~42 µs median. These are genuine compute operations, not overhead. TensorRT fuses the LayerNorm and activation into a single kernel so the intermediate results stay in shared memory rather than round-tripping through HBM.
OS Runtime (Host Threading)
All three architectures show similar OS-level patterns: roughly 54% futex (thread synchronization), 16–17% epoll_wait (event loop idle), and ~8% sem_timedwait (scheduler queue). The host-side overhead is essentially constant across architectures. What changes between architectures is not in how the server threads behave — it is entirely in what the GPU executes per kernel launch.
Why Architecture Matters More Than Size
The numbers side by side:
| Metric | Linear | SeqLen |
|---|---|---|
| Model size | ~48 MB | ~48 MB |
| Parameters | Similar | Similar |
| Avg kernel time | 6.2 µs | 199 µs |
| GPU utilization | ~6% | ~96% |
Same parameter count. Same model size. 16× difference in GPU utilization.
The mechanism is GEMM shape. Linear's matmuls are [B, 1024] × [1024, 1024] — for batch 256, that is 256 rows through a 1024-wide weight matrix. SeqLen's matmuls are [B, 128, 1024] × [1024, 1024] — for the same batch, 32,768 rows through the same weight matrix. The weight matrix is identical. The number of rows the tensor cores have to process is 128× larger.
Modern GPUs are wide. The RTX Pro 6000 has enough SMs that a [256, 1024] × [1024, 1024] matmul barely touches them. A [32768, 1024] × [1024, 1024] matmul starts to fill the machine. TRT's kernel autotuner selects a 128×128×32 tile for SeqLen versus a 64×64×64 tile for Linear — the compiler itself knows that the larger matmul can support a bigger tile.
This Is Not About LLMs
A common assumption: high-end GPUs like the RTX Pro 6000 are for large models. The hardware does not care about model size. It cares about GEMM shape. Small skinny matmuls underfill SMs on any wide GPU — whether the model is a language model, an embedding model, or a classification head. The 48 MB weight limit is irrelevant; the matrix dimensions are what matter.
For any deployment with small models:
- If your model produces GEMMs where the batch dimension times sequence length is small relative to the GPU's SM count, expect low utilization regardless of parameter count.
- Batching helps — more rows in the matmul — but architecture helps more. A LinearHead served at batch 1024 still produces a
[1024, 1024]matmul. A SeqLenHead at batch 1 produces[128, 1024]per layer. Architecture sets the floor. - Sequence-length dimensions, attention mechanisms, or wide intermediate representations are not just modeling choices — they are the structural source of large GEMMs that fill tensor cores.
The Stacked Architecture Trade-Off
Stacked (5 heads via bmm) shows the middle ground: ~8–12% utilization, slightly better RPS than Linear, lower latency. The batched matrix multiply creates wider GEMMs than individual heads would produce separately — five heads in one launch rather than five sequential launches — but not as wide as SeqLen's sequence-expanded operations.
For serving multiple classification heads in production, this is a practical pattern. You get better hardware utilization than running heads independently without the latency penalty of artificially expanding sequence dimensions. The bmm fusion is the minimum viable move toward larger GEMMs.
Reading the Profiler to Diagnose the Regime
The CUDA API summary tells you which regime you're in before you look at anything else. If cuLaunchKernelEx is a significant share of your CUDA API time, kernels are small and launch overhead matters — the CPU is spending real time queuing work the GPU will finish before the next launch arrives. If cudaEventSynchronize is above 90%, two very different things can be true: either the GPU is fast and you're sync-bound on a tiny model (Part 2), or the GPU is busy and the CPU has nothing to do but wait. The kernel duration in the GPU summary disambiguates the two: sub-millisecond kernels indicate a tiny fast model; tens or hundreds of microseconds indicate a model that actually fills the SMs.
For LinearHead, cuLaunchKernelEx at 39.4% of CUDA API time means the CPU is doing real work per launch — the 6.2 µs kernels finish so fast that the CPU overhead of the next launch is not negligible. For SeqLen, cuLaunchKernelEx at 2.3% means the launch overhead is background noise relative to the 199 µs kernel duration. The GPU has taken over.
Part 2 and Part 3 showed bottlenecks external to the model: memory transfer gaps for large models, CPU sync overhead for tiny models. Here the bottleneck is in the model itself — specifically, in whether the architecture generates matmuls wide enough to occupy the hardware. LinearHead does not. SeqLenHead does. Same weights, different shapes, a 16× gap in GPU utilization.
The profiler reveals which regime you're in. The architecture determines which regime you're in.