TL;DR — bert-tiny (4.4M params) completes a full inference batch in under 0.5 ms — fast enough that the CPU sync cycle becomes the dominant cost. cudaEventSynchronize consumes 97–99% of CUDA API time across every configuration tested, and no amount of tuning (preferred batch sizes, instance counts, queue delays) moves the throughput needle more than a few percent. CUDA graphs are the one lever that structurally reduces overhead, but even they don't break the sync loop. The real fix is either a larger model or async dispatch that doesn't block after every batch.
Part 2 established the pattern for mid-large models: the GPU executes kernels efficiently, and idle time comes from memory transfer gaps between launches. Multiple instances fill those gaps by overlapping compute from different streams. Batch size reduces the gaps by making each kernel large enough that transfers become negligible. Both paths converge on the same throughput ceiling.
This post is Part 3 of the four-part series where we discuss about GPU utilizaion with small models. Small models break that story entirely. The bottleneck moves off the GPU and onto the CPU.
Table of contents
- The Setup
- Reading the Profiler Output
- Results
- What Actually Happens During a Forward Pass
- The Root Cause: Sync-Bound, Not Compute-Bound
- The Profiler, Run by Run
- Cross-Experiment Numbers
- Why Config Changes Don't Fix It
- The Single-Instance Surprise
- Why This Differs From Large Models
- What Would Actually Help
- The Core Contrast
The Setup
The model is prajjwal1/bert-tiny — a 2-layer BERT with hidden size 128, roughly 4.4M parameters and a ~4 MB TensorRT plan. It's the smallest end of the transformer spectrum, which turns out to be the central finding: a model this fast exposes a bottleneck that larger models never encounter.
The stack is identical to Part 1:
- Triton Server:
nvcr.io/nvidia/tritonserver:26.02-py3 - TensorRT:
nvcr.io/nvidia/tensorrt:26.02-py3 - GPU: RTX Pro 6000, 97,887 MiB VRAM, CUDA 13.1
- Load testing: Locust, 1,000 concurrent users, each request carrying 50 data points
- Profiling: Nsight Systems (
nsys)
max_batch_size is 2048 across all runs. Each run was ~2 minutes. Seven configurations were tested: a baseline with 4 instances and no preferred batch sizes, then progressively tuned — larger preferred batch size lists, more instances, longer queue delays, and finally CUDA graph optimization.
Reading the Profiler Output
Nsight Systems reports work across three layers: what runs on the GPU, the CUDA API calls the CPU makes to manage it, and the OS-level threading underneath. Here are the operations that appear throughout this post.
GPU-side
| Operation | What it does |
|---|---|
myelinGraphExecute | The TensorRT inference graph running on the GPU — the actual forward pass with all fused layers executing as one unit. Its median time is the real GPU compute cost per batch. |
ExecutionContext::enqueueV3 | TensorRT submitting a batch onto a CUDA stream. Wraps myelinGraphExecute plus context setup overhead. |
ForeignNode[cls_token_embedding_castOut] | The output copy step — moving the cls_token embedding from internal GPU buffers to the output tensor. Data movement, not compute. |
sm80_xmma_gemm_* | Tensor Core matrix multiplications — the core compute of the transformer layers. Multiple GEMMs run inside each myelinGraphExecute call (attention projections, FFN layers). |
CPU-side (CUDA API)
| Operation | What it does |
|---|---|
cudaEventSynchronize | The CPU thread blocks here, waiting for a CUDA event to signal that GPU work is done. When this dominates the CUDA API summary, the CPU is spending most of its time waiting rather than working. |
cuLaunchKernel / cuLaunchKernelEx | CPU pushes a kernel onto the GPU's work queue. Fast individually (~4–5 µs each), but adds up with many small kernels per batch. |
cudaMemcpyAsync | CPU initiates an async host-device copy. Non-blocking for the CPU, but the transfer still consumes GPU time. |
cudaGraphLaunch | CPU replays a previously captured CUDA graph — the entire execution pattern in one call instead of re-launching each kernel individually. Only appears when optimization.cuda.graphs: true is set (Runs 5 and 6). |
OS runtime
The osrt_sum report captures host-side threading. Three syscalls are worth knowing: futex is the Linux kernel's fast mutex — every lock and thread wake/sleep in Triton goes through it, so high futex time means heavy thread coordination overhead. sem_timedwait is Triton's internal scheduler waiting for work in the batching queue. sem_wait indicates a model instance is not yet available; high total time here means instance contention.
TensorRT and Triton
The stack and config knobs (dynamic_batching, default_queue_policy, optimization.cuda.graphs) are covered in Part 1. The short version: TensorRT compiles the model into a hardware-specific fused execution plan, and myelinGraphExecute in the profiler is the result of that — one kernel for the full forward pass rather than dozens of separate dispatches. cuda.graphs: true goes further and eliminates the per-kernel CPU launch overhead by replaying the entire dispatch sequence as a single call.
Results
| Run | Instances | preferred_batch_size | queue_delay (µs) | RPS | p50 (ms) | p95 (ms) | p99 (ms) |
|---|---|---|---|---|---|---|---|
| Baseline | 4 | — | 500 | 941 | 630 | 740 | 830 |
| 1 | 4 | [512, 1024, 2000] | 500 | 958 | 620 | 710 | 770 |
| 2 | 4 | [1024, 1500, 2000] | 500 | 803 | 750 | 980 | 1100 |
| 3 | 8 | [512, 1024, 1500, 2000] | 500 | 994 | 580 | 680 | 740 |
| 4 | 6 | [512, 1024, 1500, 2000] | 1000 | 970 | 560 | 890 | 1200 |
| 5 | 6 | [512, 1024, 1500, 2048] + CUDA graphs | 1000 | 1028 | 550 | 650 | 720 |
| 6 | 1 | [512, 1024, 1500, 2048] + CUDA graphs | 1000 | 973 | 600 | 710 | 850 |
Each run was a two-minute window, so small RPS differences between configurations should not be read as signal — at this timescale, variance from request timing and scheduling noise can easily account for fluctuations of a few percent. What matters here is not which run edged out another by 30 RPS, but the structural pattern: every configuration lands in the same narrow band, and the profiler tells you why. Compare that to Part 1, where going from one instance to five nearly doubled throughput (11.45 → 16.78 RPS). Something fundamentally different is going on here.
What Actually Happens During a Forward Pass
Before reading the profiler output, it helps to understand the full path a batch takes through this stack. Each inference cycle looks like this:
Request arrives
  → Dynamic batcher queues it; waits for preferred_batch_size or queue_delay timeout
  → Instance becomes available (sem_wait)
  → enqueueV3 submits the batch to a CUDA stream
      → GPU executes: myelinGraphExecute (GEMMs, fused ops, attention)
      → GPU copies output: ForeignNode (cls_token_embedding to output buffer)
  → cudaEventSynchronize: CPU blocks until GPU signals completion
  → Response returned to client
  → Instance released back to pool
For a large model, the GPU steps in the middle take 20–50 ms. The sync at the end is a tiny fraction of that. For bert-tiny, myelinGraphExecute completes in under 0.5 ms. Everything outside the GPU steps — queuing, scheduling, synchronizing, thread coordination — takes longer than the actual compute.
The Root Cause: Sync-Bound, Not Compute-Bound
The CUDA API summary (cuda_api_sum) is unambiguous. cudaEventSynchronize consumes 97–99% of all CUDA API time across every single run. This is the CPU thread blocked, waiting for the GPU to signal that a batch is done before it schedules the next one.
The pipeline diagram makes the consequence visible:
CPU: [schedule] [enqueue] [wait.............] [schedule] [enqueue] [wait.............]
GPU:            [run ~0.4ms]  [idle]                     [run ~0.4ms]  [idle]
The GPU runs for under half a millisecond, then idles while the CPU synchronizes and prepares the next dispatch. The OS-level profile (osrt_sum) confirms the CPU isn't doing useful work during those waits — roughly 51% of OS time goes to futex (thread synchronization locks), 15% to epoll_wait (event loop idle), and 8% to sem_timedwait (scheduler queue). The CPU threads are blocking on each other, not launching GPU work.
This is what produces the 50–85% temporal GPU activity range — the fraction of wall time during which any kernel is executing on the GPU. The GPU is fast enough that the CPU simply cannot keep it fed. This is a different metric from SM utilization (how much of the GPU's compute capacity is occupied during those bursts), which for a model this small would be far lower.
The Profiler, Run by Run
The Nsight timeline makes the idle gaps concrete. The three profiles below show the GPU at progressively better configurations. The ratio to watch is compute-burst duration versus the idle gap that follows.
Baseline: Dispatching as Fast as Possible
The baseline config dispatches immediately when any batch is available, with no preferred batch sizes and a 500 µs queue delay.
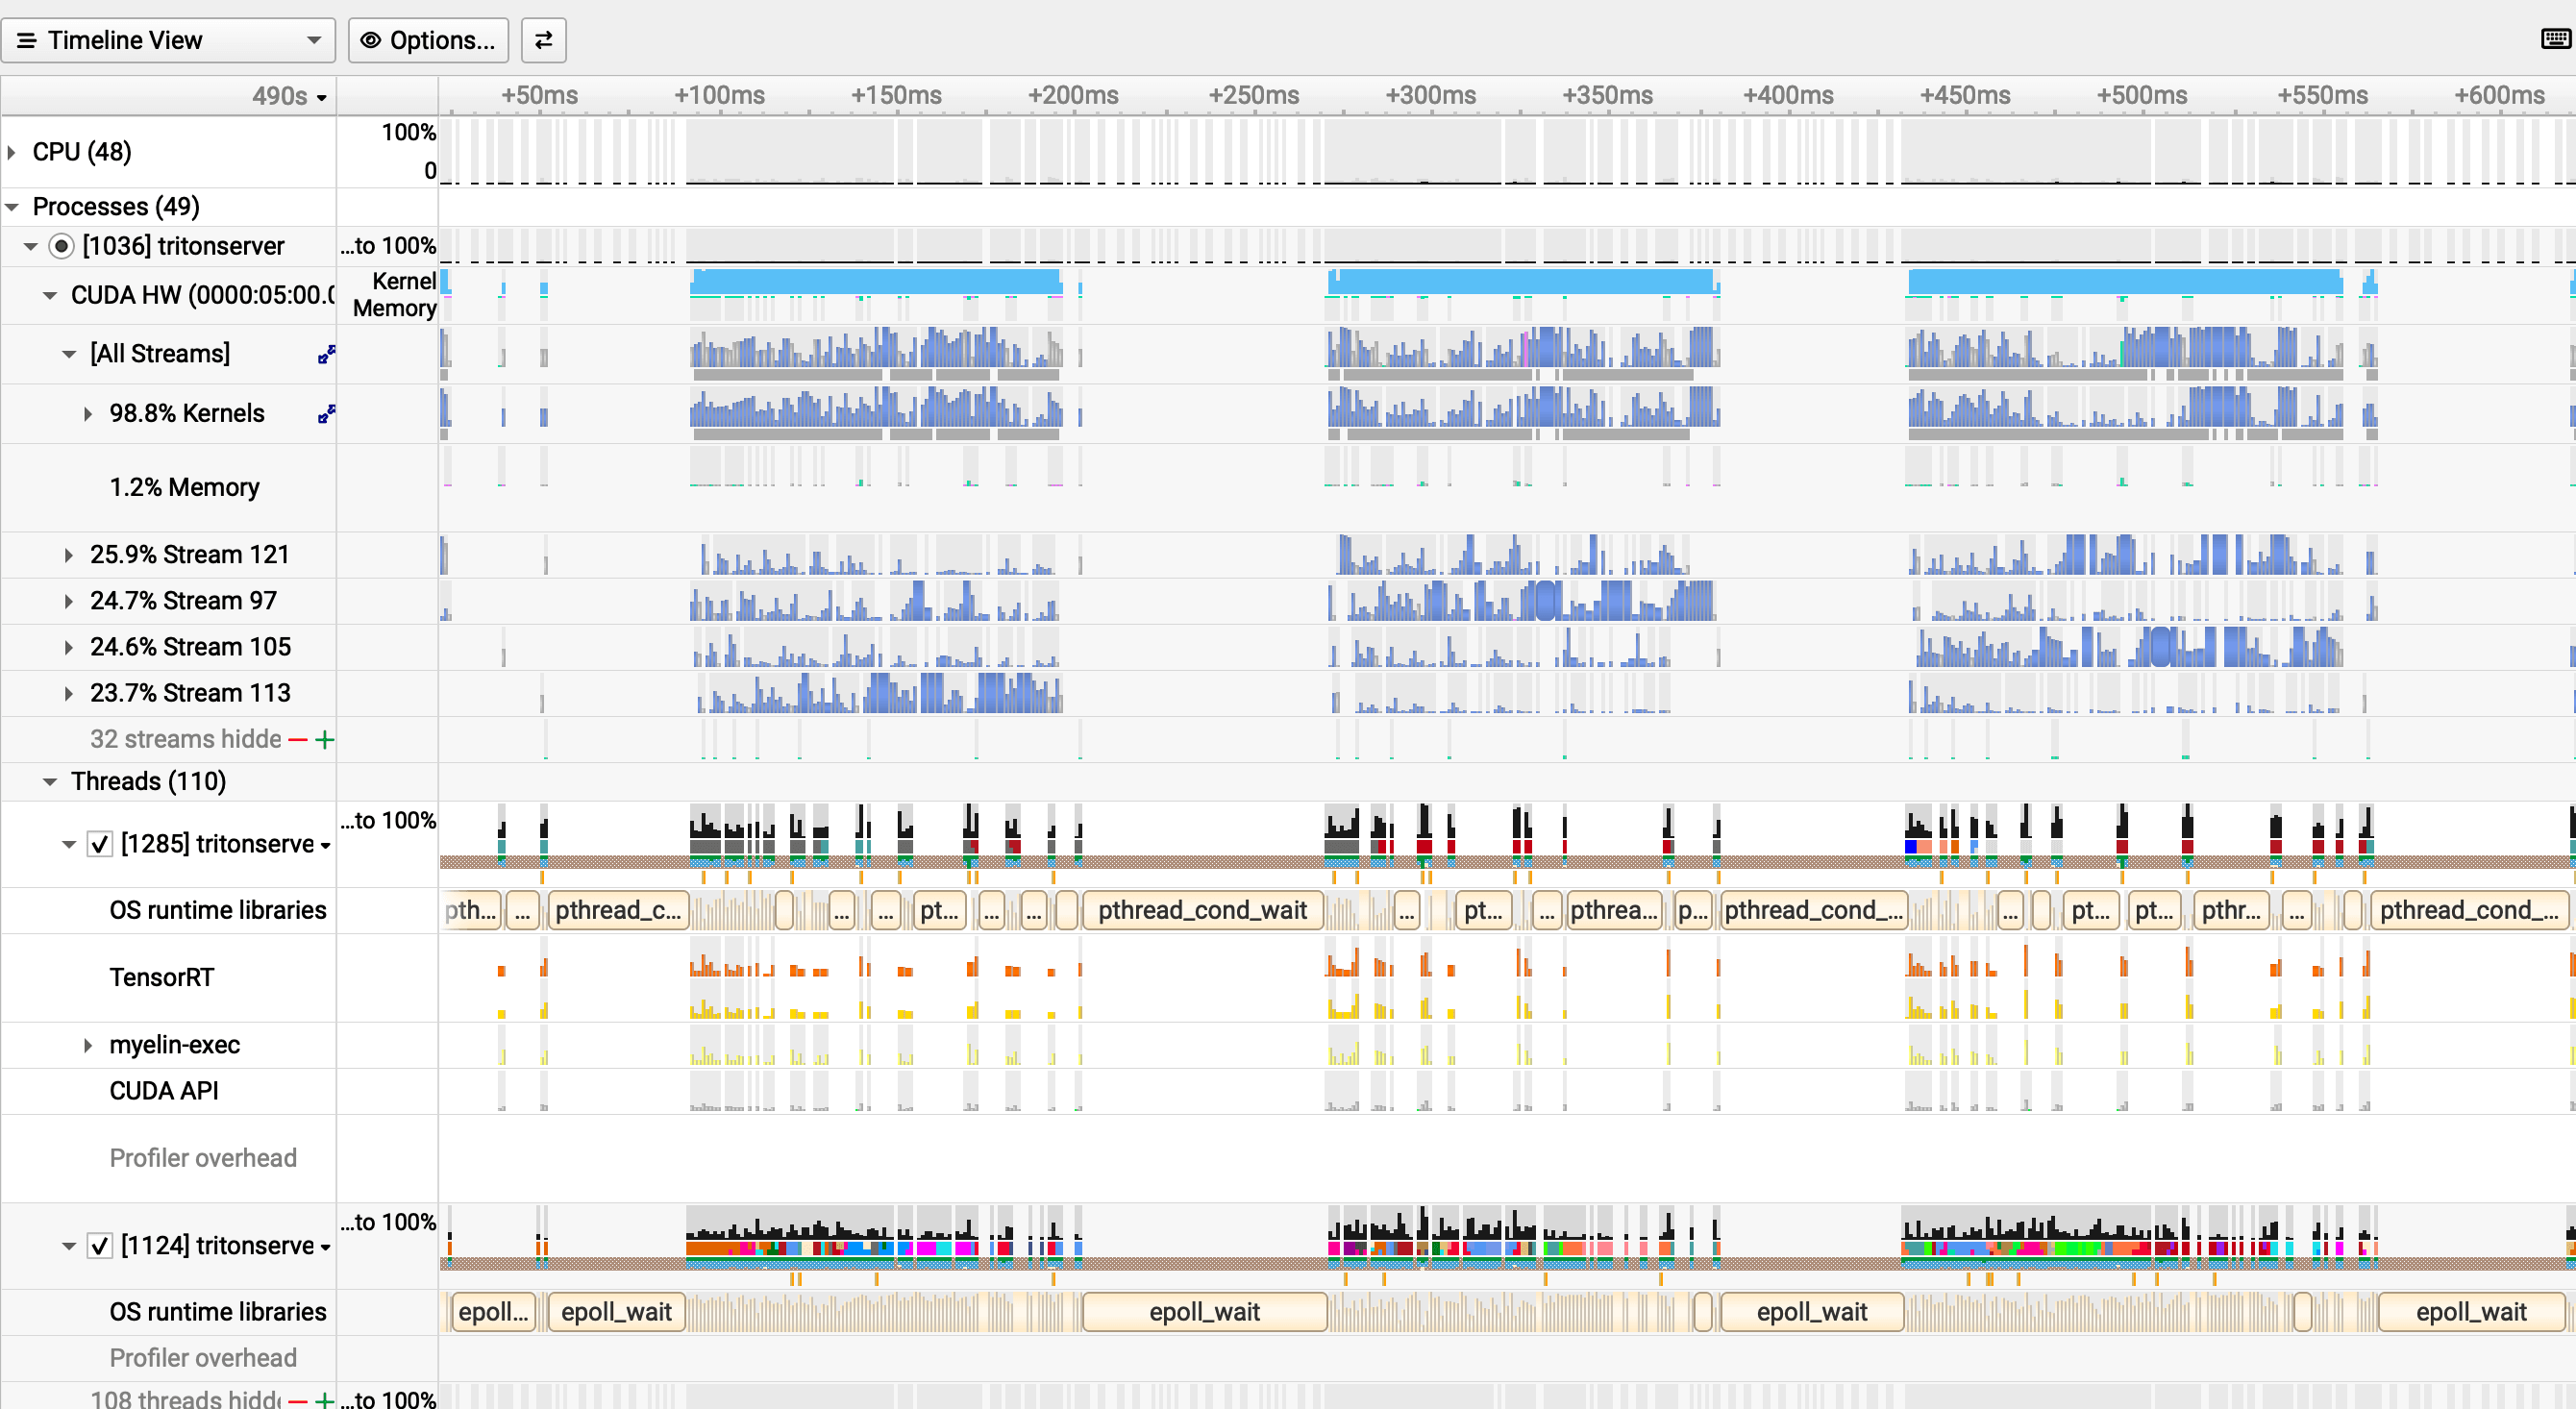
The snapshot captures a window of smaller batches where compute bursts appear around ~113 µs each, separated by idle gaps of ~52 µs — the GPU is idle for roughly 30% of this window. The full-run profiler summary tells a different story: the median myelinGraphExecute duration is ~350 µs (from the cross-experiment table below), reflecting the full distribution of variable batch sizes the baseline config allows. In both views the cause is the same: H2D copies average only 18 µs at 0.43 MB, so the idle gaps are not from memory transfer — they come from the CPU sync-and-reschedule cycle between batches. Four instances help, but they're all serializing through the same cudaEventSynchronize pattern.
Run 3: Eight Instances, More Streams
Eight instances with preferred batch sizes [512, 1024, 1500, 2000].
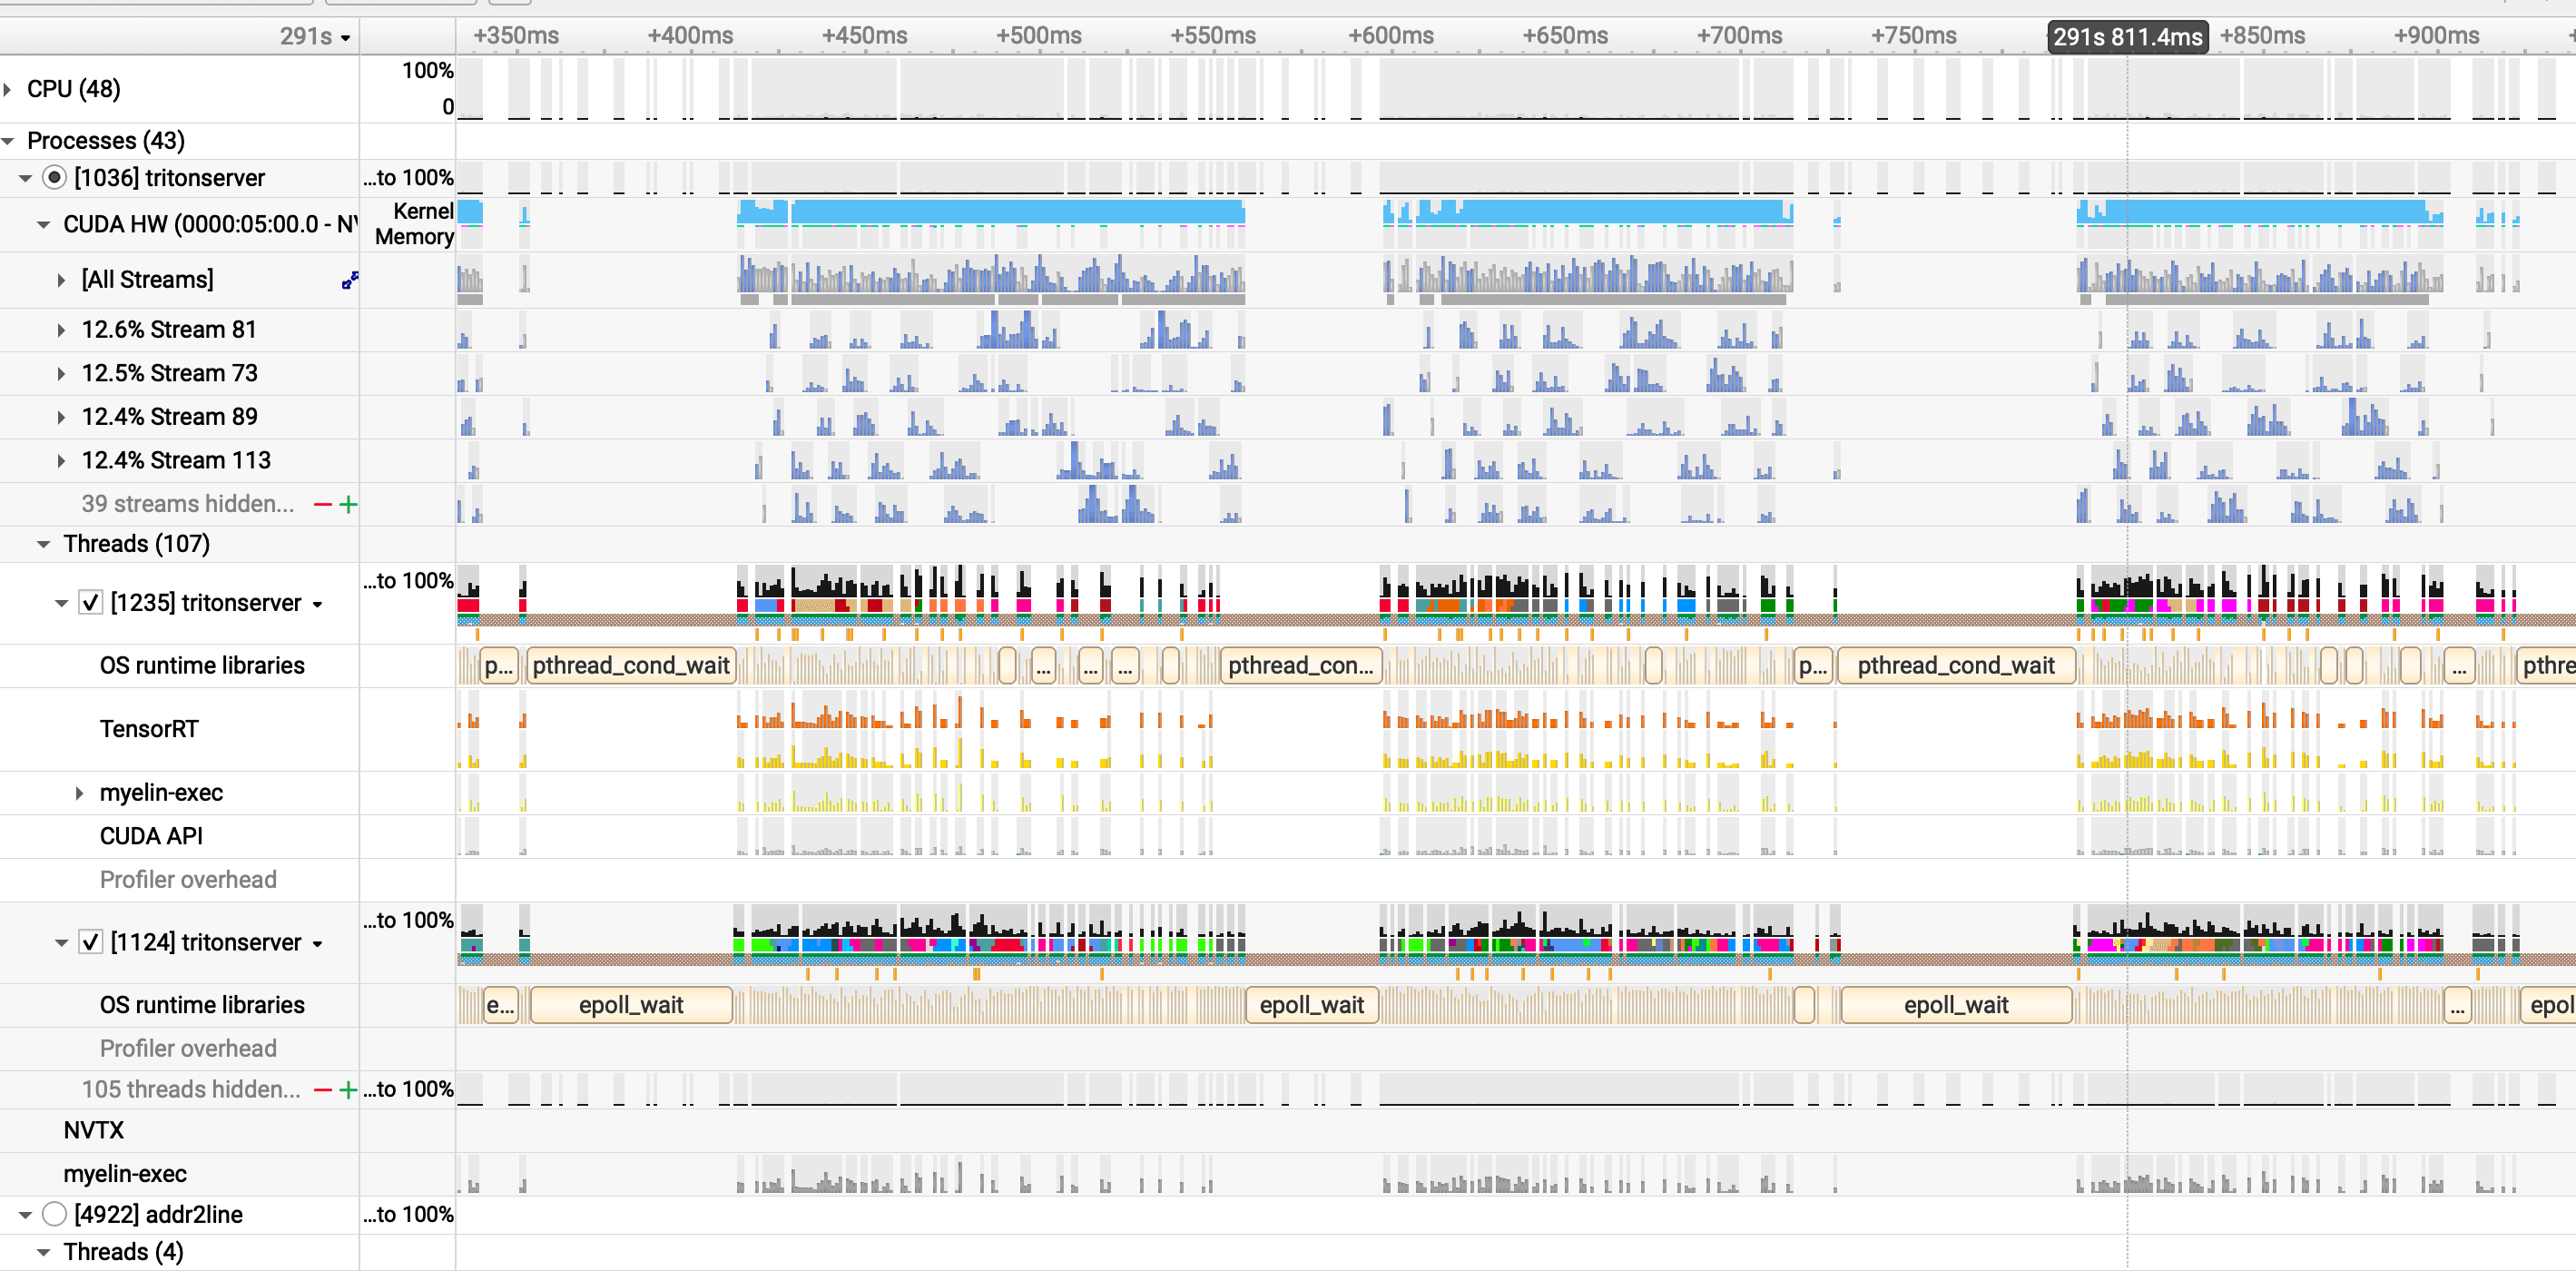
Counter-intuitively, the idle gap grows to ~74 µs despite doubling the instance count. More CUDA streams mean more thread coordination overhead — sem_wait total climbs from 238B ns to 520B ns. Work is also split across more instances, so each dispatch carries a smaller batch (0.34 MB avg vs 0.43 MB baseline). The 8 instances generate more dispatches (36,941 vs 27,529) but the GPU still finishes each one in ~307 µs. Net result: +5.6% throughput, but more idle time per cycle than the baseline.
Run 5: CUDA Graphs Shift the Balance
Six instances with CUDA graphs enabled (optimization.cuda { graphs: true, output_copy_stream: true }) and a 1,000 µs queue delay.
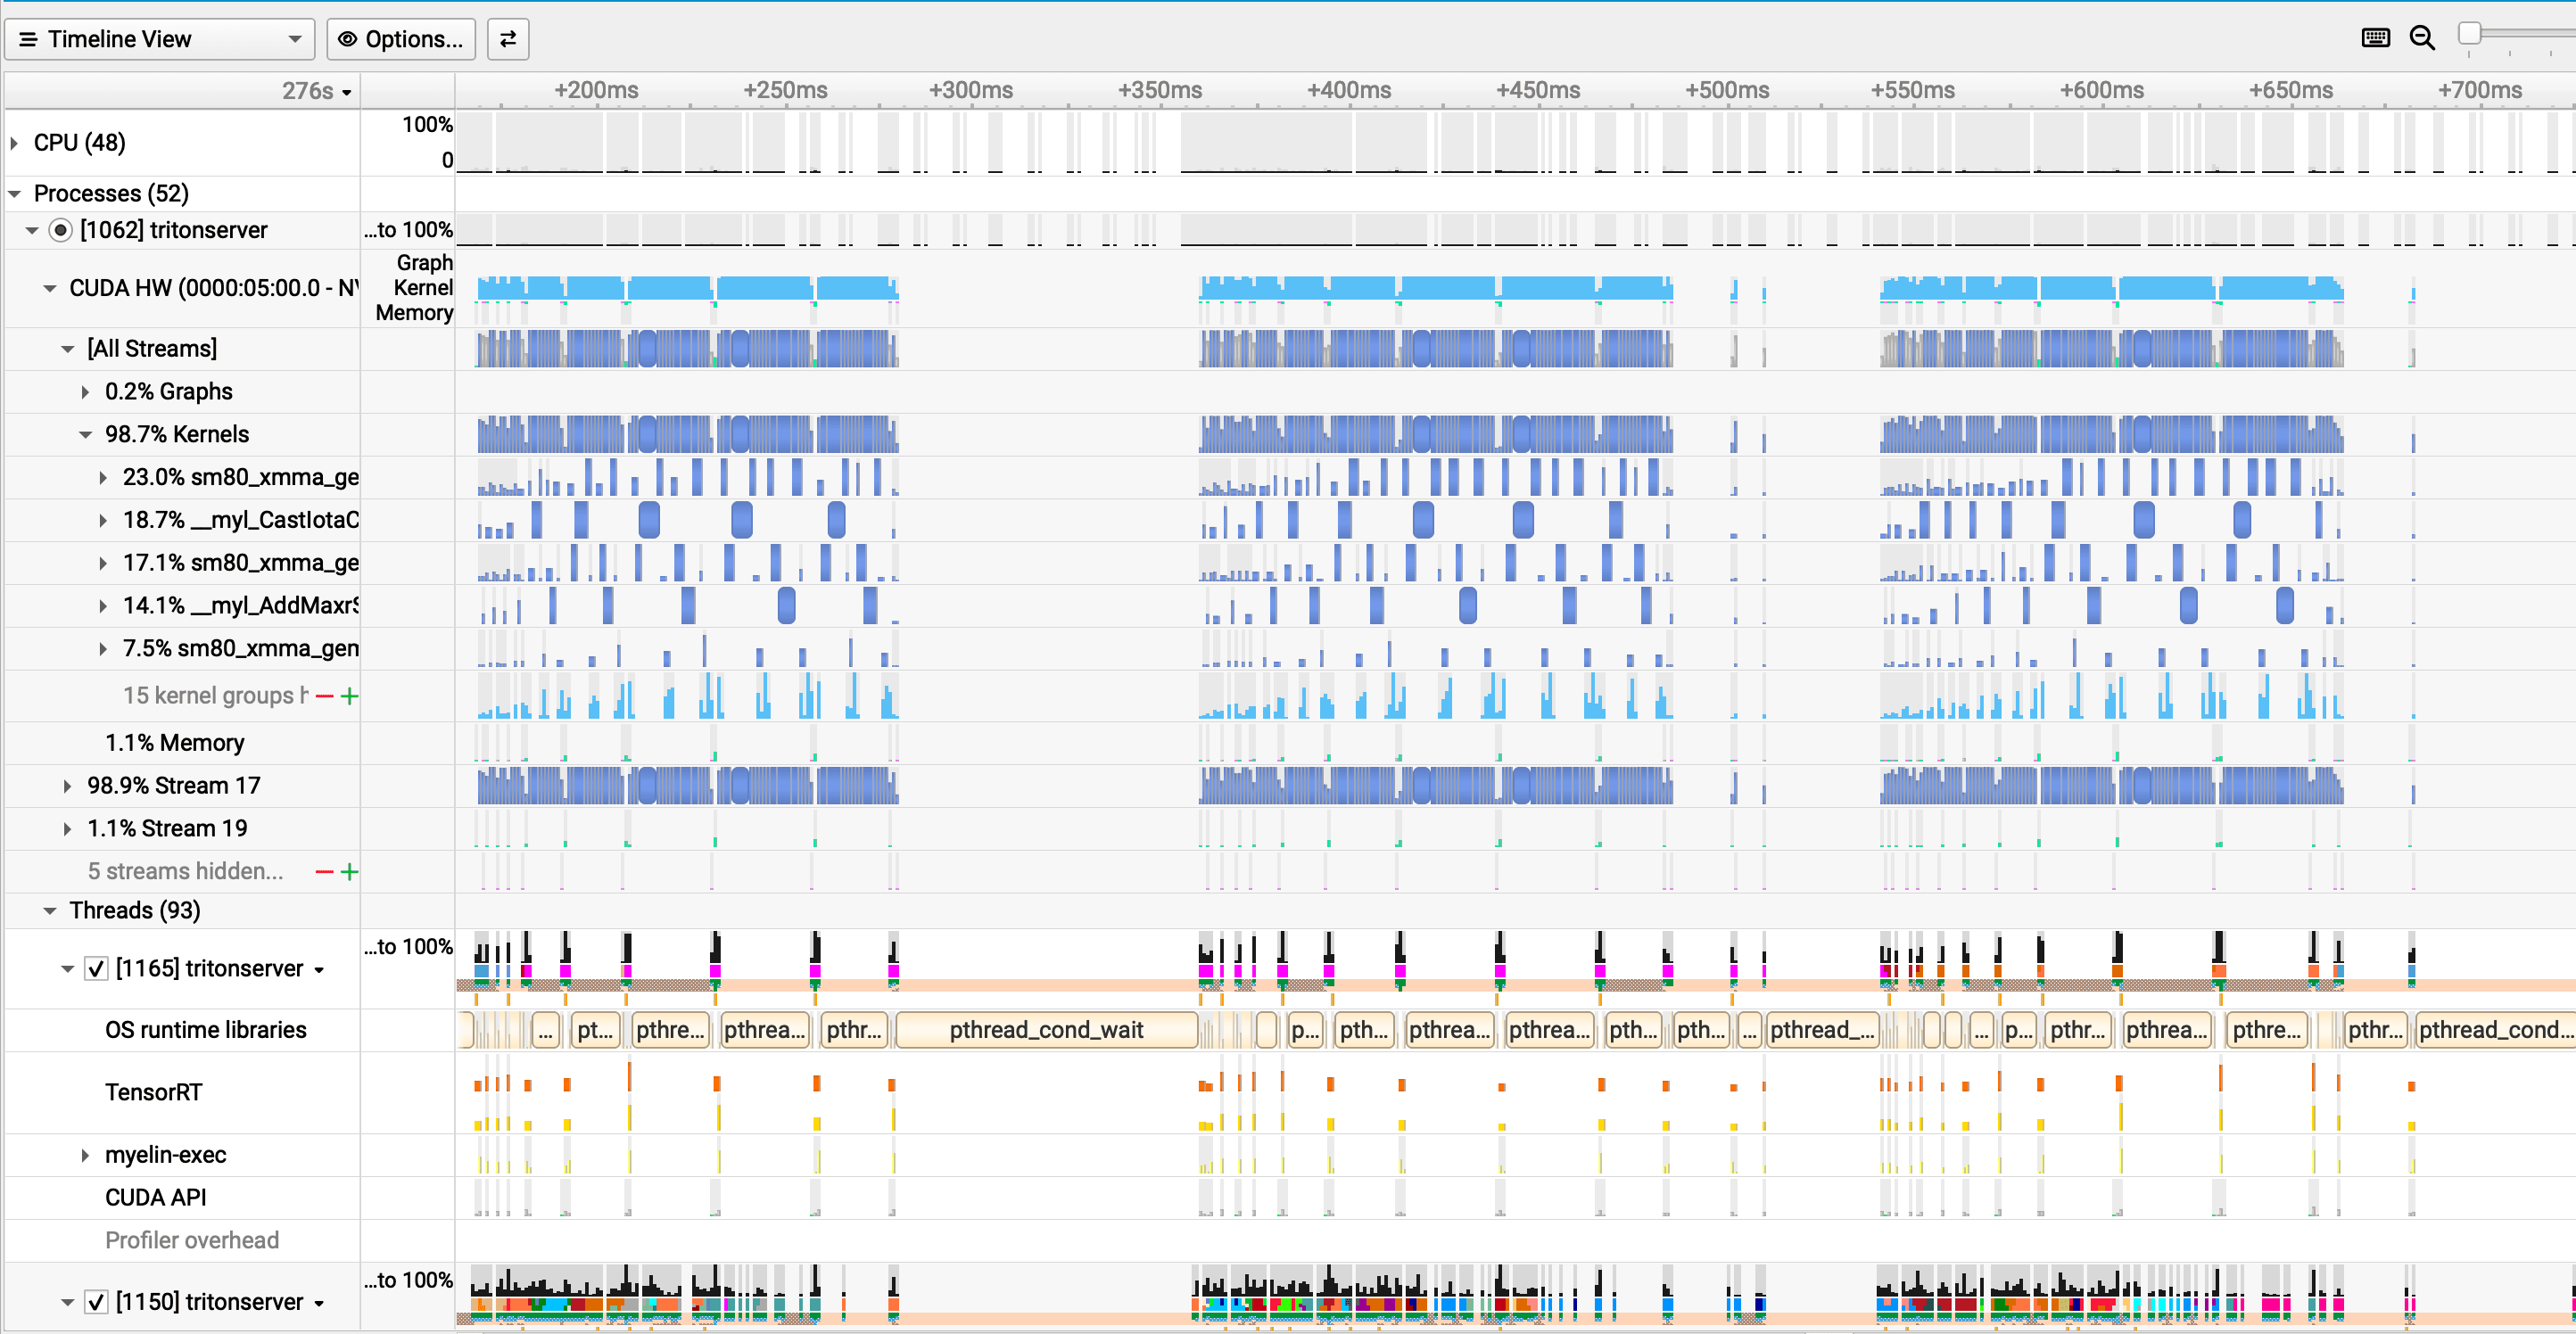
The compute burst extends to ~130 µs and the idle gap shrinks to ~56 µs. CUDA graphs capture the full kernel launch sequence on the first execution and replay it as a single call on subsequent batches — eliminating the per-kernel CPU setup overhead that normally runs between every dispatch. More of each GPU cycle goes to actual computation. The cudaEventSynchronize sync is still there at 99% of CUDA API time, but the overhead surrounding each sync event is reduced.
Cross-Experiment Numbers
The table below puts all seven runs on the same axes. Reading across it explains why most config changes had limited impact.
| Run | Inst. | GPU compute med (µs) | Dispatches | Sync % CUDA | sem_wait (B ns) | H2D avg (MB) | RPS |
|---|---|---|---|---|---|---|---|
| Baseline | 4 | 352 | 27,529 | 97.9% | 238 | 0.43 | 941 |
| 1 | 4 | 330 | 20,134 | 98.7% | 261 | 0.60 | 958 |
| 2 | 4 | 296 | 22,577 | 98.4% | 209 | 0.45 | 803 |
| 3 | 8 | 307 | 36,941 | 98.9% | 520 | 0.34 | 994 |
| 4 | 6 | 348 | 24,527 | 98.9% | 387 | 0.50 | 970 |
| 5 | 6 | 348 | 25,376 | 99.0% | 410 | 0.51 | 1028 |
| 6 | 1 | 417 | 7,864 | 97.4% | 71 | 1.54 | 973 |
GPU compute median barely moves — 296 to 417 µs across all configurations. The GPU finishes fast regardless. cudaEventSynchronize never drops below 97% of CUDA API time. Those two facts explain why every run lands in the same regime. RPS differences between configurations are small enough that a two-minute load test cannot reliably distinguish signal from noise; the profiler is the better instrument here.
Run 3's row is worth studying. Eight instances generate the most dispatches (36,941) and the most sem_wait contention (520B ns), while each instance gets smaller batches (0.34 MB avg). More parallelism, more overhead — and the CPU is no less bottlenecked than before.
Run 6 is the most revealing. One instance, largest batches (1.54 MB avg), fewest dispatches (7,864), lowest contention (71B ns sem_wait) — and the profiler still shows cudaEventSynchronize at 97.4% of CUDA API time. The sync loop is unchanged regardless of how the work is distributed.
Why Config Changes Don't Fix It
Each change targets a different surface, but none reaches the underlying sync loop.
preferred_batch_size hints to the dynamic batcher about which sizes to target. Adding [512, 1024, 2000] (Run 1) makes no meaningful difference — under 1,000 concurrent users, batches form fast anyway and the batcher was not the constraint. Going heavier with [1024, 1500, 2000] (Run 2) is actively harmful: the scheduler waits longer to fill larger batches, the queue builds, and median latency climbs to 750 ms while the GPU still finishes each batch in ~300 µs. The bottleneck moved further upstream without touching the sync loop.
More instances (Run 3: 8 instances) does add parallelism, but the profiler shows the cost: sem_wait total more than doubles from 238B ns to 520B ns, each dispatch carries a smaller batch (0.34 MB avg vs 0.43 MB baseline), and the idle gap between compute bursts grows to ~74 µs despite the additional CUDA streams. More parallelism creates more synchronization overhead. The GPU utilization doesn't improve.
CUDA graphs are the one lever that structurally changes anything. By recording the kernel launch sequence once and replaying it as a single call, they eliminate the per-kernel CPU setup overhead between every dispatch. The compute burst in the Nsight timeline visibly extends (~130 µs vs ~113 µs baseline). But cudaEventSynchronize rises to 99% of CUDA API time in Run 5 — graphs reduce overhead around each sync event; the sync events themselves remain.
The comparison table shows the profiler-level effect of each change. RPS figures are included for reference, but with two-minute test windows the small differences between runs are not reliable enough to rank configurations — what the profiler shows about the sync loop is:
| Change | Profiler effect | Median latency delta | Why limited |
|---|---|---|---|
| preferred_batch_size added | No change to sync% | −10 ms | Batches already form fast under load |
| Instances 4 → 8 | sem_wait 238B → 520B ns; idle gap grows | −50 ms | More streams, more sync contention |
| Instances 4 → 6 + queue 1ms | sem_wait 238B → 387B ns | −70 ms | Slightly better balance, sync unchanged |
| 6 inst + CUDA graphs | Compute burst extends; idle gap shrinks; sync% 99% | −80 ms | Best structural result, sync still dominates |
| 1 inst + CUDA graphs | sem_wait drops to 71B ns; H2D grows to 1.54 MB avg | −30 ms p50, +20 ms p99 | Fewer sync points but no parallelism; tail widens |
The Single-Instance Surprise
Run 6 drops to a single model instance while keeping CUDA graphs and output_copy_stream enabled. The RPS figures for this run and Run 5 are close enough that the two-minute window doesn't let us draw firm conclusions about which is "better" on throughput. What the profiler does show clearly is a different operating mode.
With one instance receiving all queued work, effective batch sizes grow significantly — 1.54 MB average H2D transfer versus 0.51 MB in Run 5. myelinGraphExecute median rises to 417 µs versus 348 µs. enqueueV3 calls drop to 7,864 versus 25,376: fewer launches, fewer sync events, far less thread coordination overhead. sem_wait total falls from 410B ns to 71B ns — the contention almost disappears.
The tradeoff shows up in tail latency, not throughput. One instance queues everything sequentially. p99 rises to 850 ms versus 720 ms in Run 5. For workloads that can absorb that tail, single-instance CUDA graphs is a clean operating point. For latency-sensitive cases, 6 instances with graphs balances contention against queuing better.
Why This Differs From Large Models
The contrast with the large-model results from Part 1 is direct. For multilingual-e5-large-instruct (560M parameters), each inference batch took 20–50 ms on the GPU. The cudaEventSynchronize sync overhead — a few microseconds when the GPU is already done — was negligible. Multiple instances genuinely overlapped computation across streams and utilization reached 100%.
For bert-tiny, the GPU finishes in under 0.5 ms. The sync cycle is no longer negligible; it is the dominant cost. Adding instances multiplies sync points rather than hiding them.
| Large model (multilingual-e5-large) | Tiny model (bert-tiny) | |
|---|---|---|
| GPU compute per batch | 20–50+ ms | 0.3–0.5 ms |
| Sync overhead relative to compute | < 1% | >> 100% |
| Primary bottleneck | Memory transfer gaps | CPU sync / scheduling |
| More instances help? | Yes — overlap compute across streams | Barely — more streams = more sync points |
| GPU temporal activity (any kernel running) | 93–100% | 50–85% |
What Would Actually Help
The most direct fix is deploying a larger model. A 560M parameter model takes long enough per batch that sync overhead becomes a negligible fraction of total GPU time. The bottleneck shifts to memory transfer latency — a problem that instances and batch size can solve, as Part 1 showed.
For staying with a small model, the path forward requires changing the execution model rather than the config. Async enqueue without immediate synchronization — pipelining multiple batch dispatches before blocking on completion — would let the CPU stay ahead of the GPU. The Triton TensorRT backend synchronizes after each batch by design; removing that requires backend-level changes. It's not a tuning knob.
For a 4 MB model on a high-end GPU, 50–100% utilization is expected. The GPU is simply faster than the sync pipeline can feed it. Run 5's configuration (6 instances, CUDA graphs, 1028 RPS, 550 ms median) is a good production operating point. If the goal is GPU saturation at this model size, the constraint is architectural.
The Core Contrast
Parts 1 and 2 both held the model architecture fixed and varied the serving configuration. The bottleneck in each case was external to the model: memory transfer gaps for the large model, CPU synchronization overhead for the tiny one.
For a 560M parameter model, the GPU executes efficiently. Idle time comes from memory transfer gaps, and instances plus batch size have large leverage to close them.
For a 4.4M parameter model, the GPU also executes efficiently — so efficiently that it finishes before the CPU can queue the next batch. Idle time comes from synchronization, not memory. Config changes move the needle by single-digit percentages. The ceiling is set by the sync loop, not the hardware.
The profiler tells you which regime you're in, but cudaEventSynchronize percentage alone is ambiguous. High sync percentage means the CPU is blocked waiting for the GPU — that is true whether the GPU finished fast and is already idle, or is genuinely busy with real work. The disambiguator is kernel duration: here, GPU compute bursts run ~113–130 µs and the sync overhead around each burst is what dominates wall time. Short kernels with high sync percentage means sync-bound. Long kernels with high sync percentage means GPU-bound. The percentage looks identical; the kernel duration tells you which one it is.
Part 4 flips the variable: the serving config stays fixed, and the architecture changes. Three synthetic heads with the same parameter count produce GPU utilization numbers ranging from 6% to 96% — and the reason has nothing to do with model size.