TL;DR — For a 560M parameter embedding model on Triton + TensorRT, batch size barely matters once you have enough parallel instances — every configuration tested converged on roughly the same ~16 RPS ceiling. The actual bottleneck is idle time between kernel launches caused by memory transfer latency. Multiple instances fix this by overlapping compute across CUDA streams: when one instance is stalled on a HtoD/DtoH transfer, another has kernels ready to run. Batch size 128 with 1 instance and batch size 2 with 5 instances reach the same throughput; the multi-instance path gets there with better p50 latency.
I've been doing some load testing recently — specifically trying to understand how batch size and instance count interact for embedding models on Triton. One thing that kept coming up: people assume larger batch sizes always win, and that if you have GPU memory to spare you should use it. I wanted to actually verify that, not just take it on faith.
In Part 1 we learned how the GPU executes work. This post is Part 2 of a four-part series. Here I focus on a mid-large model and walk through what the profiler actually shows. Part 3 covers small models, where the dynamics are different enough to warrant a separate post. Part 4 holds the serving config fixed and varies the model architecture — revealing how GEMM shape, not parameter count, determines GPU utilization.
Table of contents
- The Setup
- The Runtime Stack: TensorRT and Triton
- Results
- What the Numbers Say
- What Nsight Shows
- The Core Insight
The Setup
The model is intfloat/multilingual-e5-large-instruct — a 560M parameter multilingual embedding model. It's mid-to-large for an embedding model: the matmuls are big enough to keep the GPU busy without much help from batch size, which turns out to be the central finding.
The stack:
- Triton Server:
nvcr.io/nvidia/tritonserver:26.02-py3 - TensorRT:
nvcr.io/nvidia/tensorrt:26.02-py3— more on why this specific image matters below - GPU: RTX Pro 6000, 97,887 MiB VRAM, CUDA 13.1
- Load testing: Locust, separate pod, 50 concurrent users, each request containing 50 data points (~558 KB payload)
- Profiling: Nsight Systems (
nsys) and Nsight Compute (ncu)
Batch sizes tested: 2, 4, 128. Multiple TensorRT model instances per configuration. Each run was ~2 minutes, same payload throughout, zero failures across all runs.
One thing worth calling out upfront: I hit a TensorRT bug where the runtime was clipping token embeddings during export, which caused 6–7% spurious device-to-device (DtoD) memcpy traffic and pulled kernel utilization down for reasons unrelated to the actual workload. Using nvcr.io/nvidia/tensorrt:26.02-py3 fixed the export and eliminated those transfers. All numbers below are post-fix.
The Runtime Stack: TensorRT and Triton
Before the numbers, it's worth understanding what TensorRT and Triton actually do — because most of what the profiler shows is a direct consequence of how this stack works.
TensorRT is a model compilation runtime, not an inference library. When you convert an ONNX model to a TensorRT engine, TRT runs a multi-pass optimization pipeline against the target GPU. The first pass fuses the graph: adjacent pointwise ops (add, layernorm, GELU) get merged into single kernels, and the Q/K/V linear projections in each attention block — which ONNX represents as three separate matrix multiplications — collapse into one. The resulting kernel count is a fraction of what the original graph describes.
The second pass is kernel autotuning. For each fused operation, TRT benchmarks multiple CUDA kernel implementations on the actual device using the actual batch sizes the engine will see at inference. The fastest implementation for each tactic is serialized into the .plan file. The plan is hardware-specific: an engine built on an A100 makes different kernel choices than one built on an RTX 6000. This is what myelinGraphExecute represents in the profiler — Myelin is TensorRT's code generation layer, and the kernel running under that name is the hardware-autotuned, fused forward pass.
FP16 precision compounds the gain. Halving the data width halves memory bandwidth, and more critically, it routes GEMMs through the GPU's Tensor Cores — dedicated matrix hardware that runs at dramatically higher throughput than CUDA cores for the same operation. Embedding models are almost entirely GEMMs; they map cleanly onto Tensor Core paths.
Triton sits in front of TRT and handles everything the model itself doesn't: request queuing, dynamic batching, multi-instance scheduling, and synchronization. Every Triton model is configured through a config.pbtxt — a protobuf text file that controls how batches are formed and dispatched. Three blocks matter for performance.
dynamic_batching enables Triton's batching scheduler. Without it, every request dispatches immediately and alone. With it, Triton queues requests and waits either for the batch to reach a preferred_batch_size, or for max_queue_delay_microseconds to expire — whichever comes first.
default_queue_policy governs what the scheduler does when a batch times out below the preferred size. timeout_action: DELAY holds it longer; REJECT drops it. For high-throughput workloads, DELAY prevents the scheduler from firing half-empty batches during momentary traffic bursts.
optimization is where TensorRT-specific execution settings live:
optimization {
  cuda {
    graphs: true
    output_copy_stream: true
  }
}
cuda.graphs: true tells Triton's TensorRT backend to capture a CUDA graph on the first execution of each batch size and replay it on every subsequent call — one cudaGraphLaunch replaces the full per-kernel cuLaunchKernel sequence. output_copy_stream: true pins output tensor copies to a dedicated CUDA stream so they overlap with the next dispatch rather than blocking it.
Why TRT outperforms generic runtimes. ONNX Runtime's CUDA execution provider dispatches through CuDNN and CuBLAS — well-optimized libraries, but still op-by-op. A BERT attention block that TRT fuses into one kernel becomes 8–12 separate dispatches in ORT: individual GEMMs for Q, K, V projections, softmax, element-wise adds, each reading from and writing back to global memory before the next one starts. TRT removes those round-trips at compile time. Intermediate tensors that ORT materializes in global memory can stay in shared memory or registers inside a single TRT kernel. The throughput gap narrows at large batch sizes where per-kernel overhead amortizes, and widens at small ones where it doesn't.
Results
Throughput and Latency
| # | Batch | Instances | GPU% | RPS | p50 (ms) | p95 (ms) | p99 (ms) |
|---|---|---|---|---|---|---|---|
| 1 | 2 | 1 | 93% | 11.45 | 4,000 | 4,200 | 4,400 |
| 2 | 2 | 5 | 100% | 16.78 | 2,600 | 2,800 | 3,100 |
| 3 | 4 | 1 | 94% | 14.14 | 3,200 | 3,400 | 3,500 |
| 4 | 4 | 3 | 100% | 16.65 | 2,700 | 2,800 | 3,000 |
| 5 | 128 | 1 | 100% | 15.55 | 2,900 | 3,000 | 3,100 |
| 6 | 128 | 3 | 100% | 15.95 | 2,800 | 3,000 | 3,100 |
Latency Percentiles
| # | Batch | Instances | p50 | p90 | p95 | p99 | p100 |
|---|---|---|---|---|---|---|---|
| 1 | 2 | 1 | 4000 | 4200 | 4200 | 4400 | 4400 |
| 2 | 2 | 5 | 2600 | 2800 | 2800 | 3100 | 3100 |
| 3 | 4 | 1 | 3200 | 3300 | 3400 | 3500 | 3600 |
| 4 | 4 | 3 | 2700 | 2700 | 2800 | 3000 | 3100 |
| 5 | 128 | 1 | 2900 | 3000 | 3000 | 3100 | 3300 |
| 6 | 128 | 3 | 2800 | 3000 | 3000 | 3100 | 3400 |
What the Numbers Say
The clearest result: batch size barely matters once you have enough instances. Use Cases 2, 4, and 6 — spanning batch sizes of 2, 4, and 128 with 3–5 instances — all converge to roughly 16–17 RPS with p50 latency around 2.6–2.8s. The ceiling is the same regardless of batch size.
Single-instance runs are the more instructive comparison. A single instance at batch size 2 (Use Case 1) hits 93% GPU utilization and just 11.45 RPS with a median latency of 4 seconds. Move to batch size 4 (Use Case 3) and you get 94% utilization and 14.14 RPS — a real improvement, but still not saturating the GPU. Batch size 128 with one instance (Use Case 5) finally hits 100% utilization at 15.55 RPS, but adding two more instances (Use Case 6) only squeezes out 0.4 more RPS. The GPU was already full.
Why does one instance at batch size 4 leave 6% on the table while 128 doesn't? The model is large enough that even a batch of 4 produces big GEMMs — kernel utilization is 99.9% in both cases. The idle time comes from elsewhere.
What Nsight Shows
This is where it gets concrete.
Batch Size 4, 1 Instance: Gaps in the Timeline
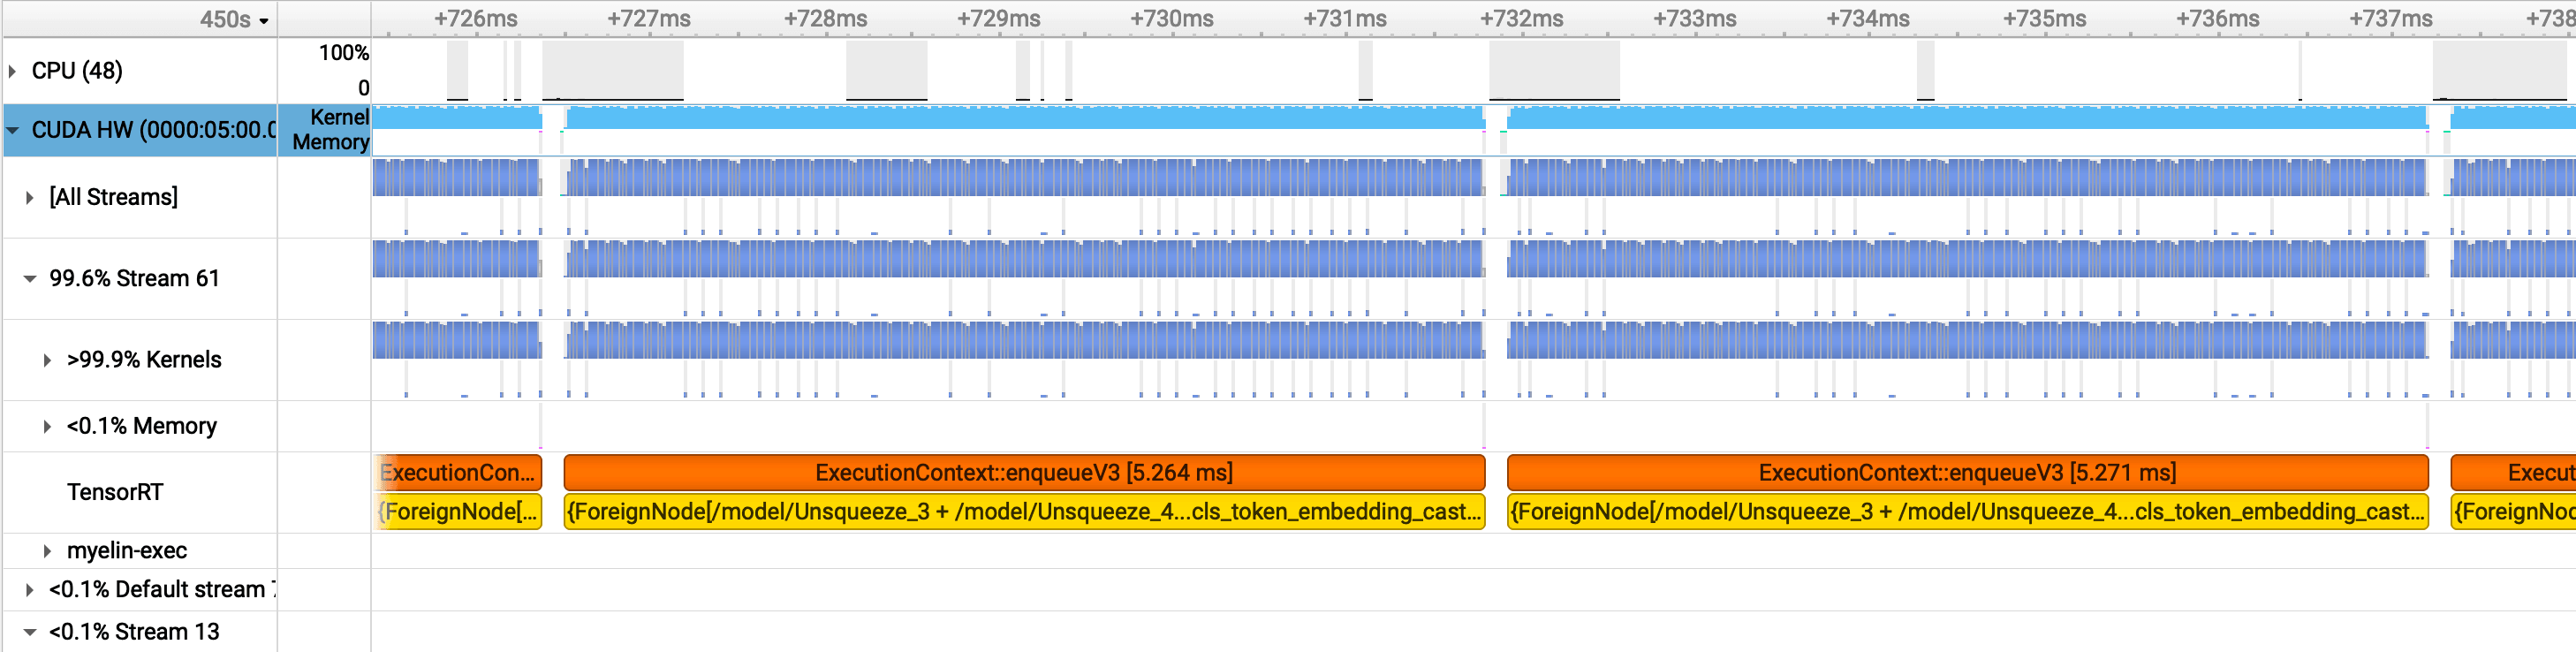
With a single TRT instance at batch size 4, the Nsight timeline shows visible gaps in GPU kernel execution. The GPU goes idle for ~145.4 microseconds between kernel launches — roughly 364,000 cycles. During that window, no compute is happening.
Zooming in makes the pattern clear:
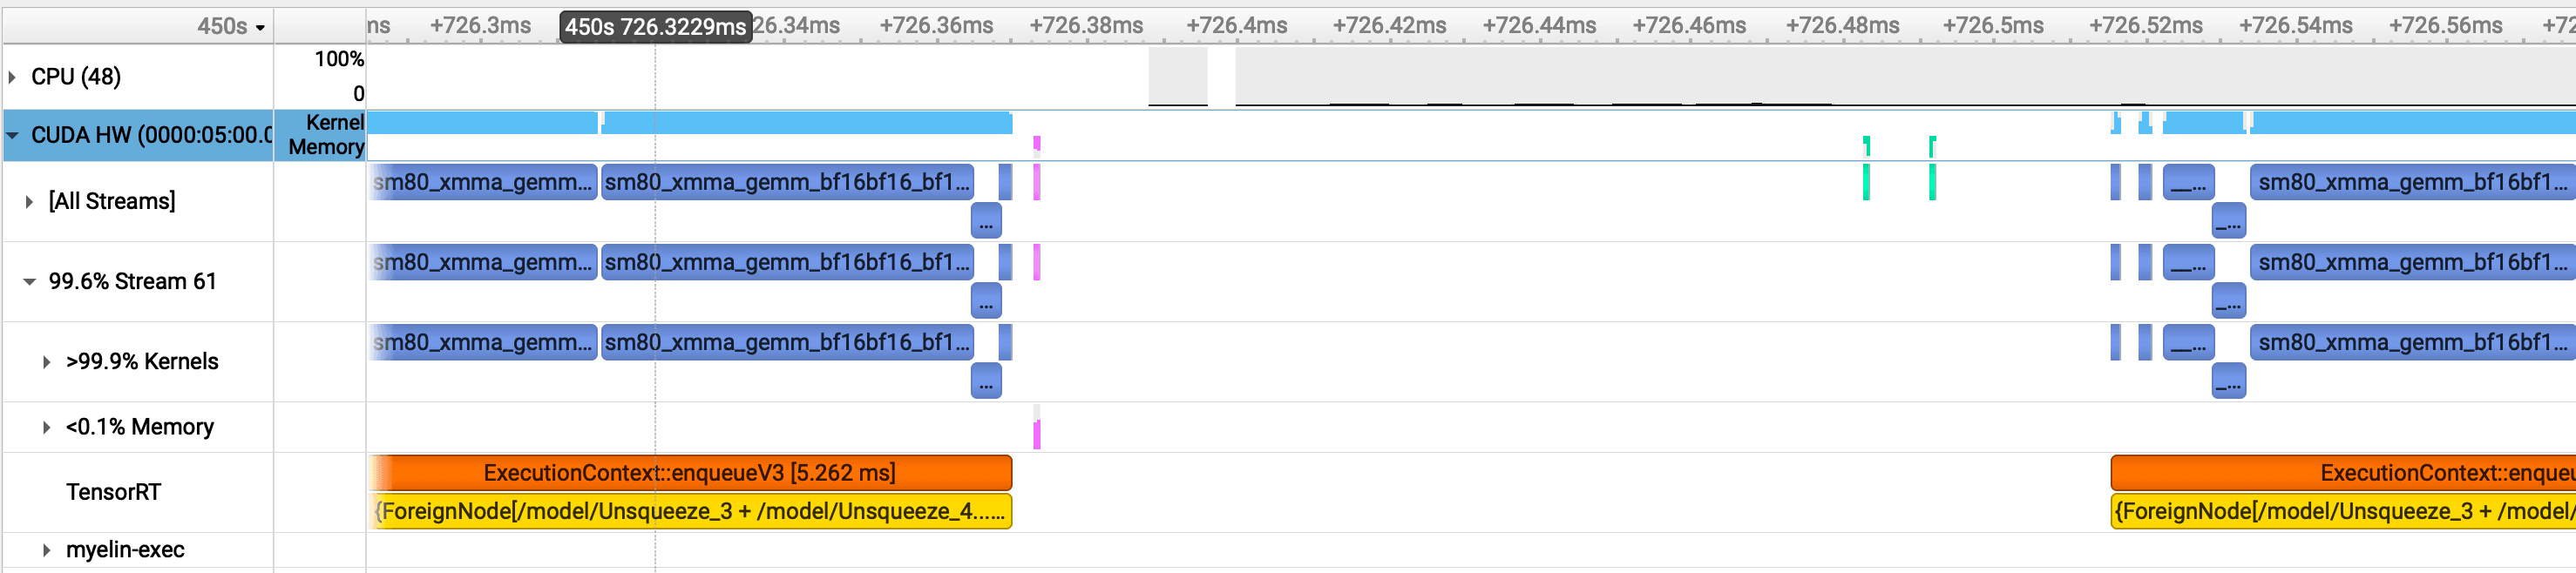
The green bars are host-to-device (HtoD) transfers — the input batch going to the GPU. The pink bars are device-to-host (DtoH) — the embeddings coming back. With a single instance, there's nothing to fill the GPU during these transfers. The GPU finishes a batch, ships the results back to host, then waits for the next batch to arrive. The SM sits idle in between. Kernel utilization is 99.9% when work is actually running — the problem isn't the kernels, it's the gaps between them.
Batch Size 4, 4 Instances: Gaps Disappear
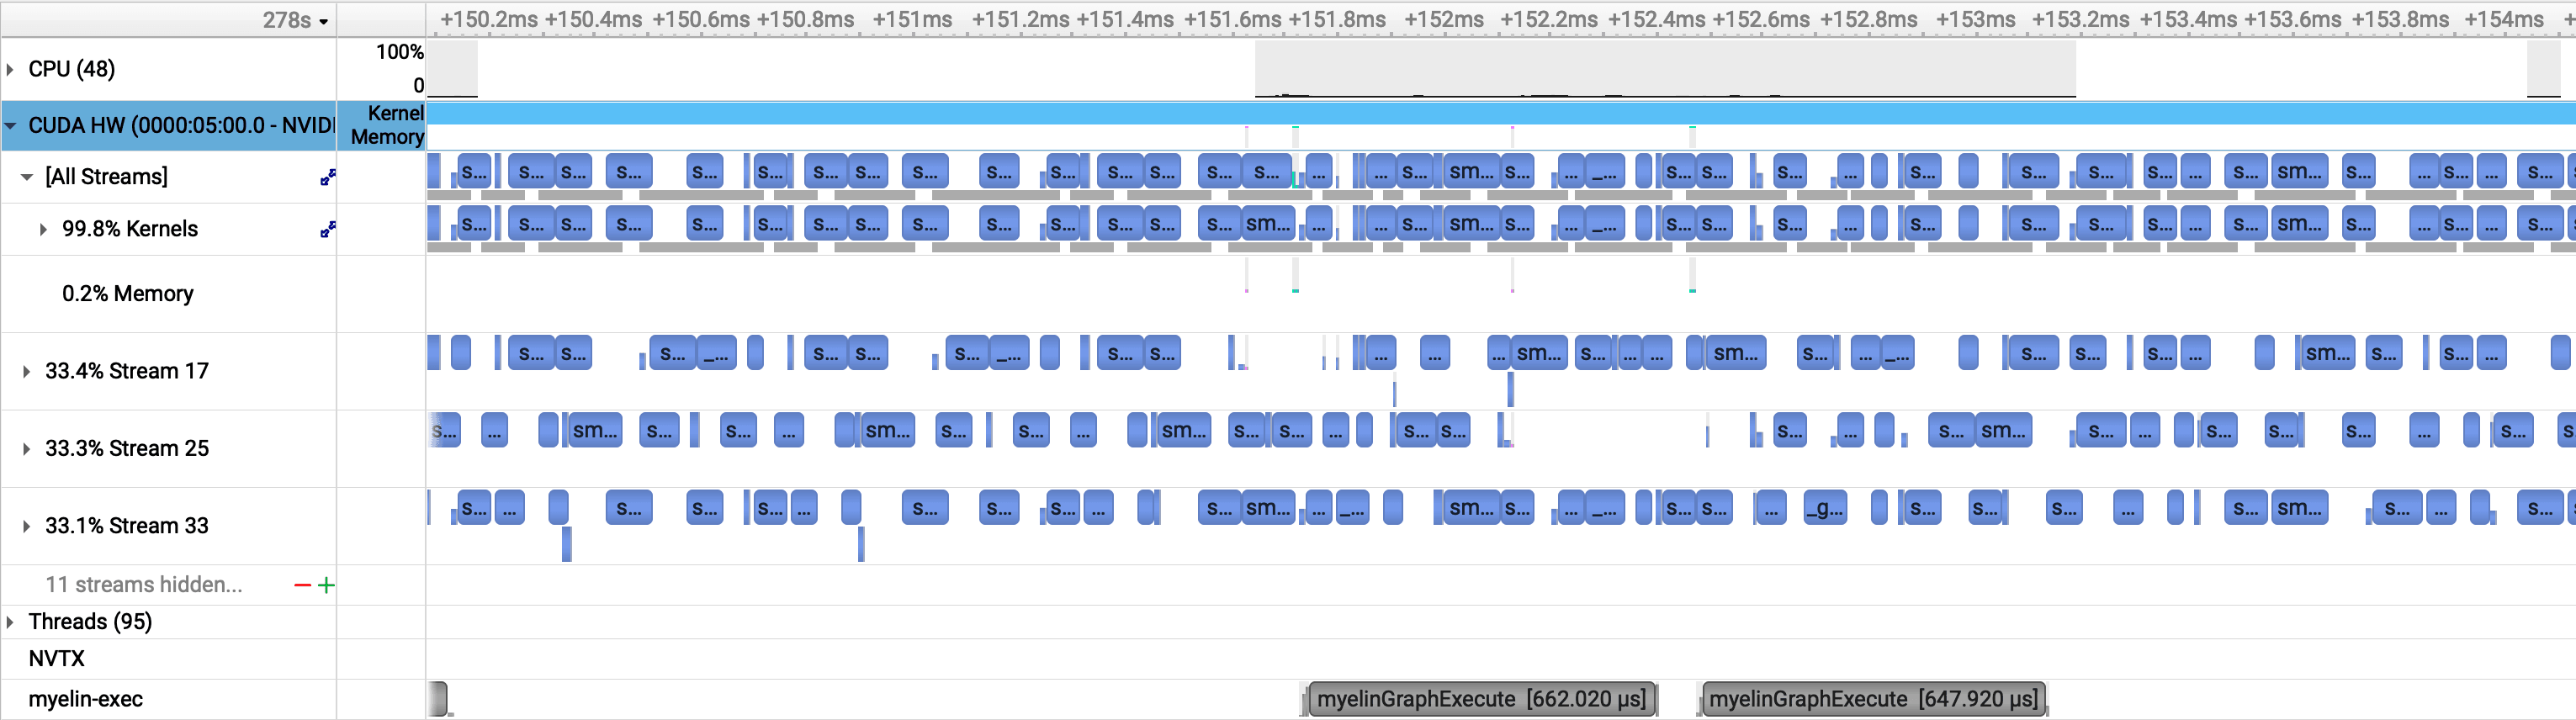
With four concurrent TRT instances, the gaps vanish. When one instance is stalled on a memory transfer, another has kernels ready to run. The SM stays occupied throughout. This is the asynchronous execution benefit in practice — CUDA streams from different instances fill each other's idle windows.
GPU utilization reaches 100% not because the batch size got bigger, but because the memory transfer latency of one instance is hidden behind the compute of another.
Batch Size 128, 1 Instance: Large Batches Pack Themselves
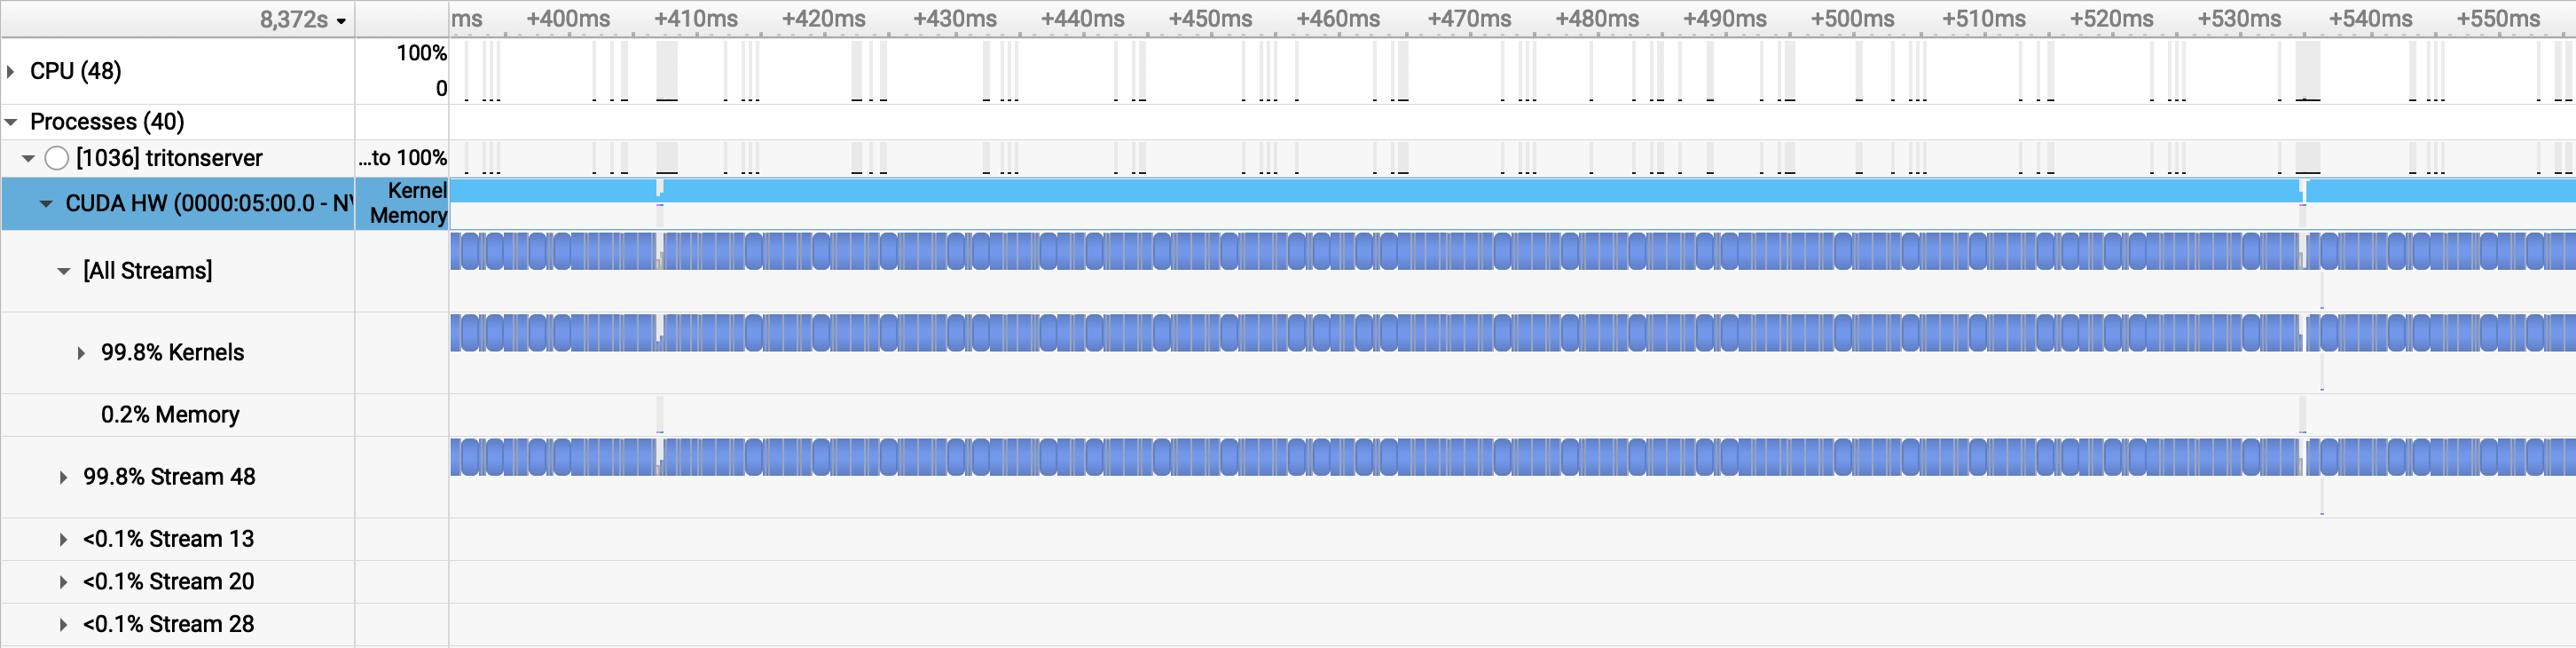
A large batch achieves something similar through a different mechanism. With 128 inputs per forward pass, each kernel is large enough that compute time dwarfs memory transfer time. The idle gaps shrink to ~2.3 microseconds (~5,700 cycles) — nearly imperceptible compared to the 145 µs gaps at batch size 4. The GPU stays busy because there's simply more work per launch.
The trade-off: large batches improve utilization at the cost of latency. At batch size 128, individual inputs wait in the queue until a full batch assembles. The p50 latency of 2.9s is better than the single-instance batch-4 case (3.2s), but still worse than multi-instance configurations (2.6–2.7s). For an embedding service under sustained load, multiple instances with small batches gets you both throughput and latency.
The Core Insight
For a model this size, the GPU is never the bottleneck in the traditional sense — it executes kernels efficiently. What limits throughput is idle time between kernel launches: the memory transfer latency that creates gaps in the SM timeline. Batch size reduces those gaps by making each kernel bigger. Multiple instances reduce those gaps by filling them with work from other streams. Both paths reach the same throughput ceiling; the multi-instance path gets there with better latency.
This also explains why going from batch 128 with 1 instance to batch 128 with 3 instances (Use Cases 5 → 6) is nearly a no-op: +0.4 RPS, negligible latency change. The GPU was already at 100% utilization. More instances on a fully saturated GPU add scheduling overhead without adding throughput.
Part 3 covers small models, where this story changes considerably. Small models produce GEMMs that don't fill the SM on their own — batch size stops being a minor optimization and becomes the primary way to get any utilization at all. The L2 cache dynamics are also different, which shows up clearly in the DtoD transfer picture. Part 4 holds the serving config fixed and varies the architecture instead, showing why two models with identical parameter counts can produce a 16× gap in GPU utilization.